
Viewing monitors and thresholds
After you add a single monitor to a metric and monitor training completes, the monitor's thresholds and any incidents detected appear on the metric's chart:
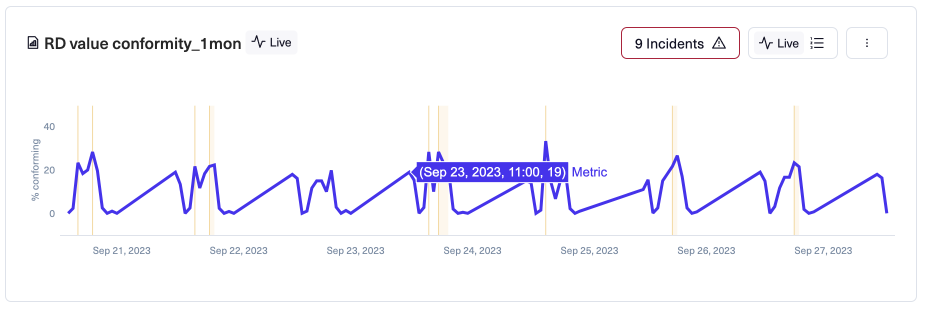
You can only view one monitor at a time. If you add more than one monitor, you can select which of them to view.
Thresholds appear as one or two dotted lines enclosing an area. You can hide the thresholds of the monitor you are viewing, leaving just the incidents that the monitor detected. Note that slow burn trend change monitors do not have thresholds.
The count of incidents (indicated by the incidents menu button) is totaled for all monitors, and so may not match the number of incidents you see when viewing a specific monitor. If you stop viewing a monitor without selecting another monitor to view, incidents for all monitors appear on the chart and the number matches the count on the menu button.
Monitor type chart differences
Each monitor type has a somewhat different effect when viewed on a metric chart.
Value out of expectations
Automatically detects thresholds through training.
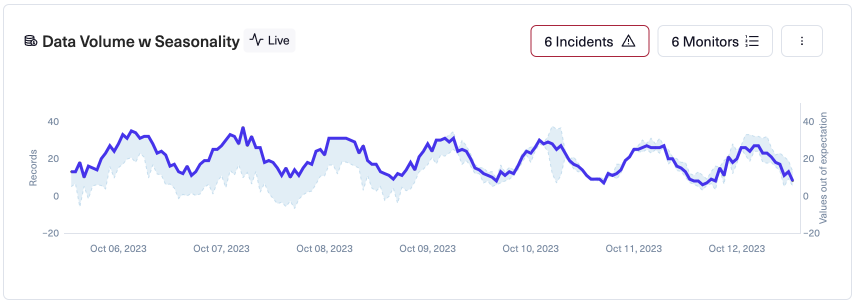
- Metric values (datapoints) appear as a solid line.
- When you select View Threshold for this monitor, thresholds appear as dotted lines enclosing an area.
- Each incident appears as a vertical line at the time the incident started followed by an area showing the incident duration.
Sharp change
Detects when metric value suddenly moves more than expected based on training. Thresholds are calculated based on the feature, which by default is the double derivative of the metric value. (You can select other features using Advanced training options.)
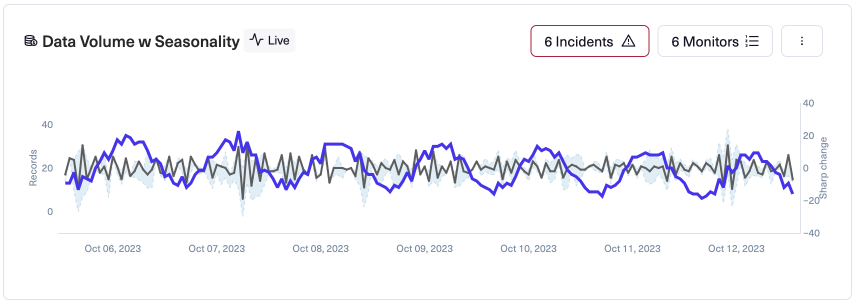
- Metric values (datapoints) appear as a solid line.
- When you select View Threshold for this monitor, thresholds appear as dotted lines enclosing an area, and the feature values appear as a solid line.
- Each incident appears as a vertical line at the time the incident started followed by an area showing the incident duration.
Manual threshold
Detects when metric falls outside of manually-entered thresholds. You can specify the upper threshold, the lower threshold, or both. Thresholds can be for metric values, the percent change value-over-value, or the absolute change value-over-value.
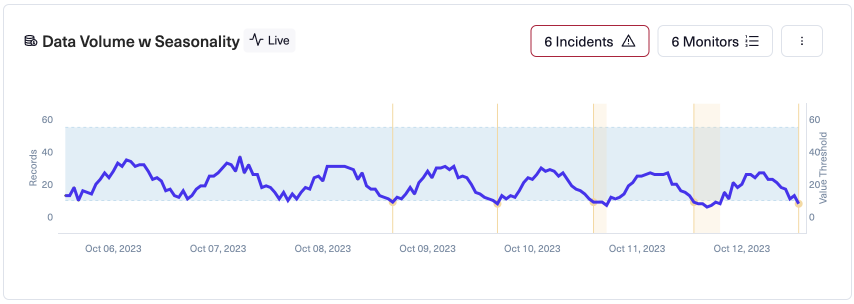
Manual thresholds - upper is 55, lower is 10
- Metric values (datapoints) appear as a solid line.
- When you select View Threshold for this monitor, thresholds appear as one or two dotted lines enclosing an area. If only one threshold is set, the area extends from that dotted line to the top or bottom of the chart (depending on which threshold is set).
- Each incident appears as a vertical line with a dot intersecting the threshold at the time the incident started, followed by an area showing the incident duration.
Updated 10 months ago