
Manage incidents
When a monitor detects a variation that's out-of-bounds, it logs an incident. Each incident is specific to one monitor, and has a start time, a severity, a direction, a duration, and a status. When a monitor logs an incident, you can analyze the incident to determine its cause so you can address it in your production data.
When you want to work with incidents as opposed to analyzing a specific one, you have several options:
- The Incidents list is a central place to work with all the incidents in the workspace. You can review all of an incident's details by selecting its ID in the Incidents list.
- The Incident dashboard provides summary information about a workspace's incidents, and links to the Incidents list so you can drill down.
- The Explorer tree gives you a 7-day window into incidents on a metric. If a metric has incidents, they'll appear in Explorer, and clicking on the metric's Incidents menu opens a list of its incidents in the 7-day window. You can change the window to expand it, and from the list, you can select any incident to analyze it.
- The Table Health tab lists a table's metrics, and shows a count of incidents for each. You can select a listed metric's name and then select View in Explorer. You can then click on the metric's Incidents menu as in the preceding item.
The Incidents list
With a workspace selected, select Incidents on the top bar to open the Incidents list.
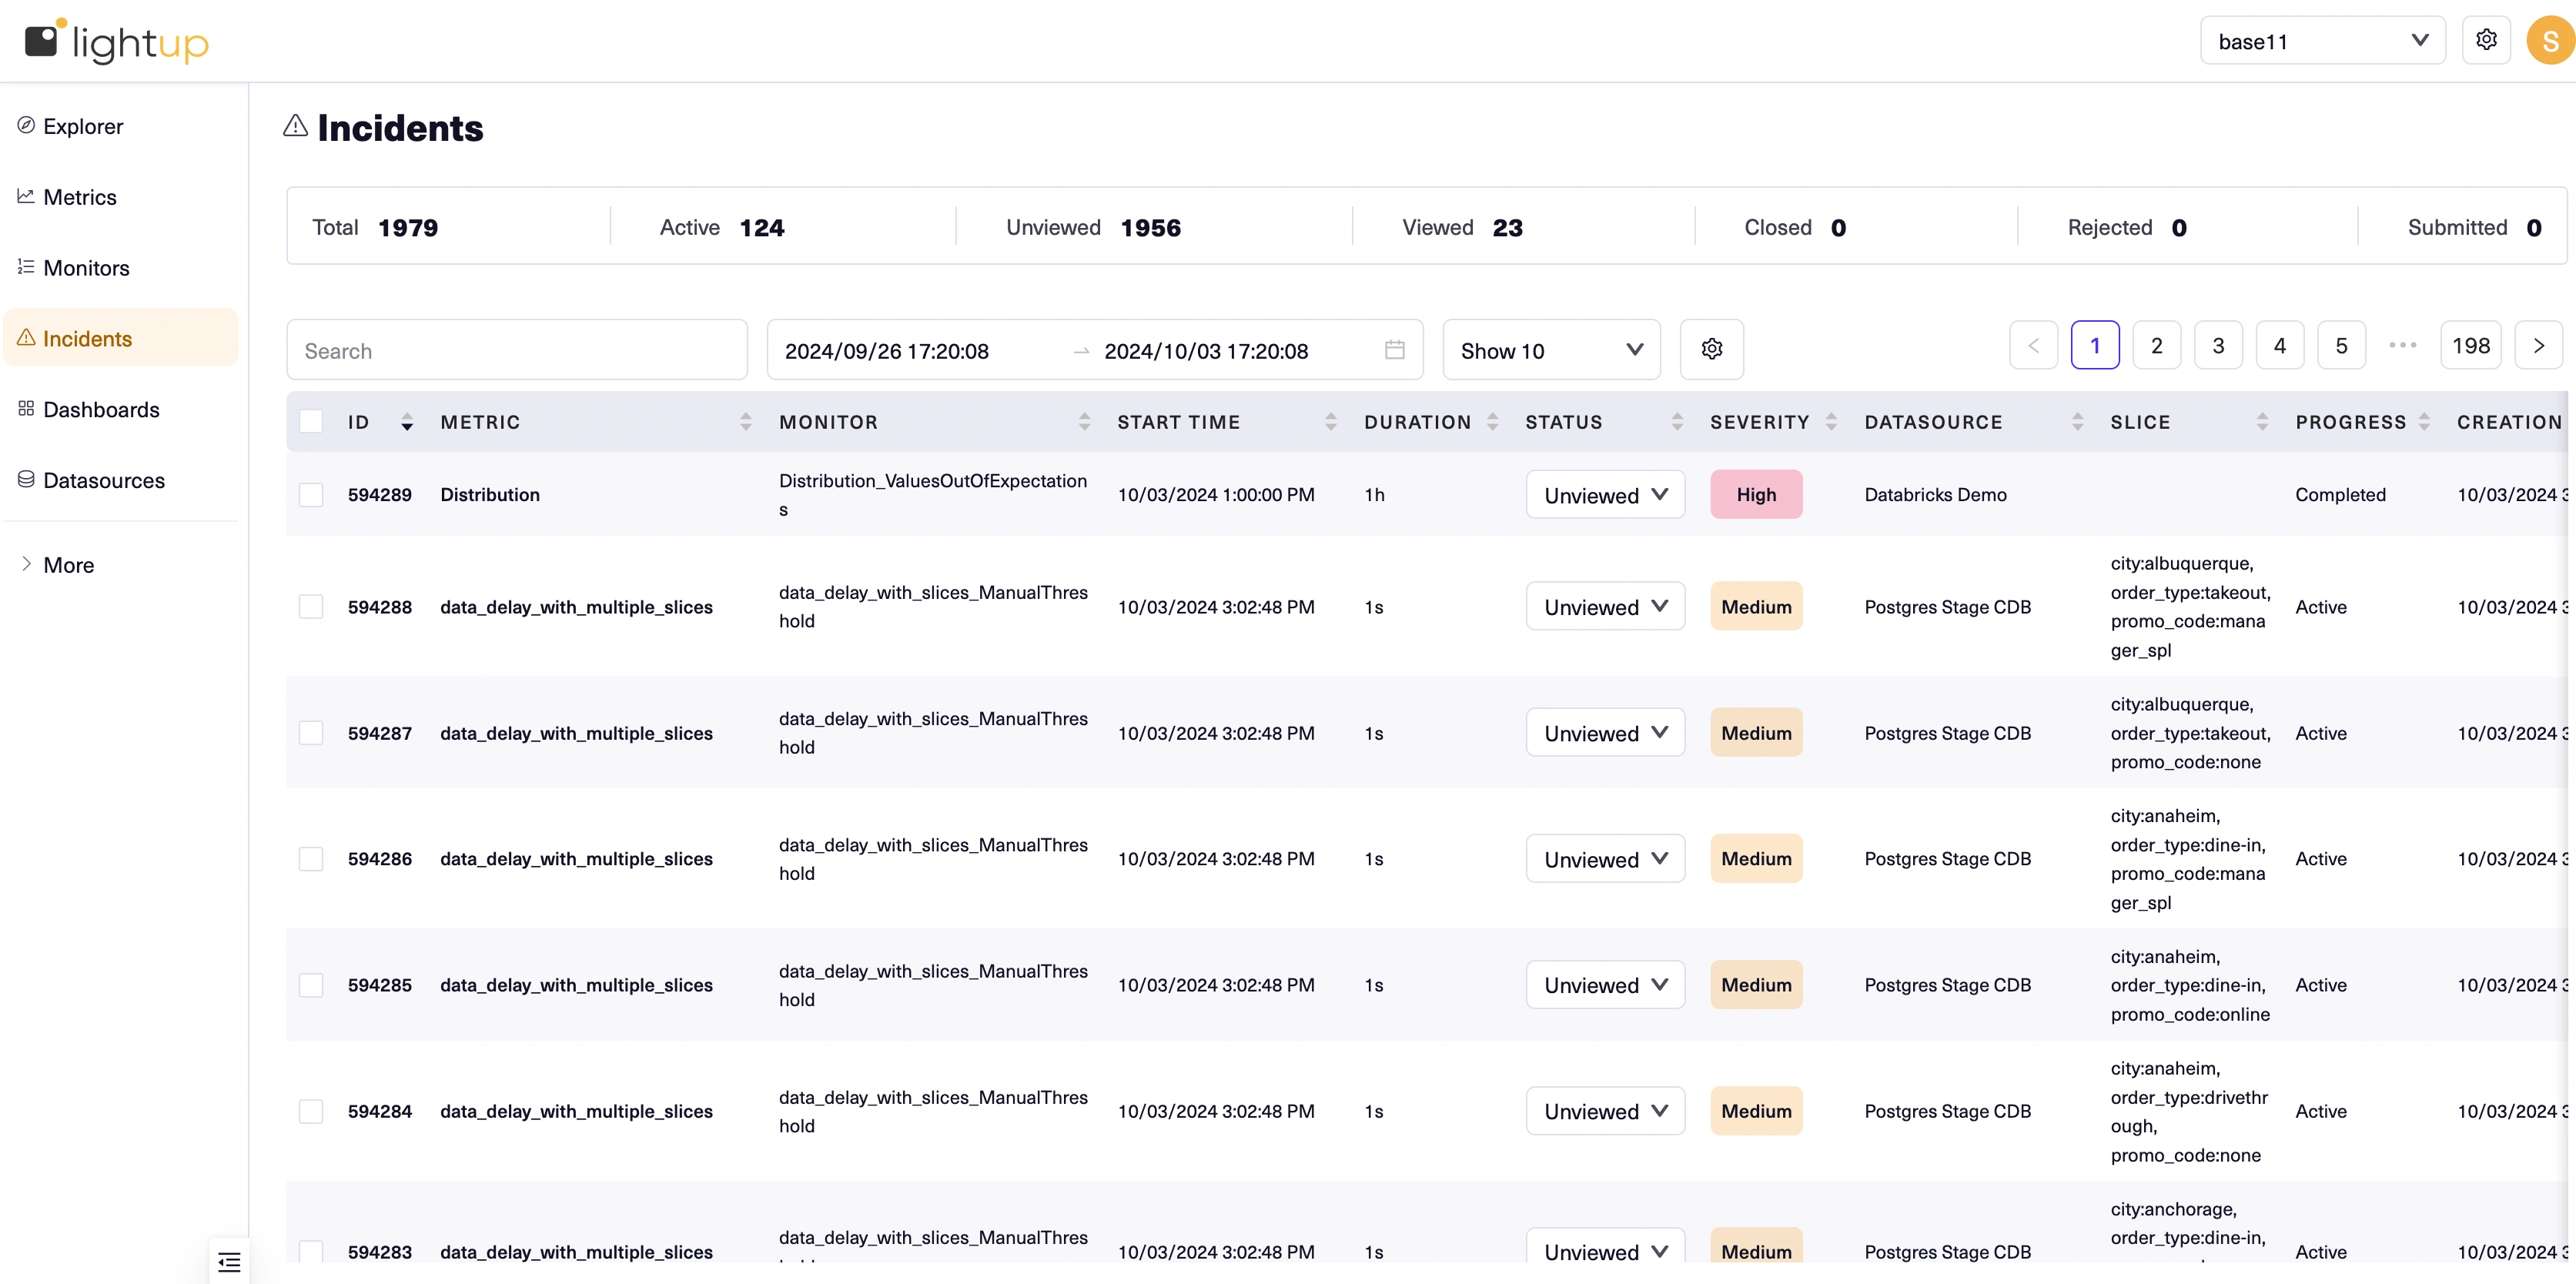
- Tiles across the top display summary information about incidents in the workspace
- Search applies list filters by id or by attribute. Click the Search box and type or scroll to find a search term, then select a term to filter the list to matching items. You can add multiple search terms to narrow down the displayed items more.
- You can click the ID of an incident to open it, and you can click the name of a metric to edit the metric or view it in Explorer.
- If you don't see the field you want, select the gear icon and select/deselect fields to display.
- Lightup updates the Status of an incident from Unviewed to Viewed when someone views the incident details— but you can set it back.
- The check boxes on the far left allow you to use bulk operations to change the Status of multiple incidents, or validate multiple incidents.
Setting incident status
You can select a different Status for one or more incidents in the Incidents list. Most status changes don't affect how Lightup works— they are for your use to assist your team in managing incidents. There are two exceptions:
- If you set the status of an incident to Rejected it won't show up in Explorer views (e.g., the Incidents menu on a metric chart won't include the incident in the count the Incident menu displays). Further, if the monitor that detected the incident has Incident Learning enabled , it ignores Rejected incidents when learning.
- If the incident stauts is Unviewed and anyone opens the incident details, Lightup changes the incident status to Viewed. You can set incident status back to Unviewed, which will persist until someone opens the incident details again.
The Incident dashboard
For an overview of a workspace's incidents, on the Dashboards tab select Incident.
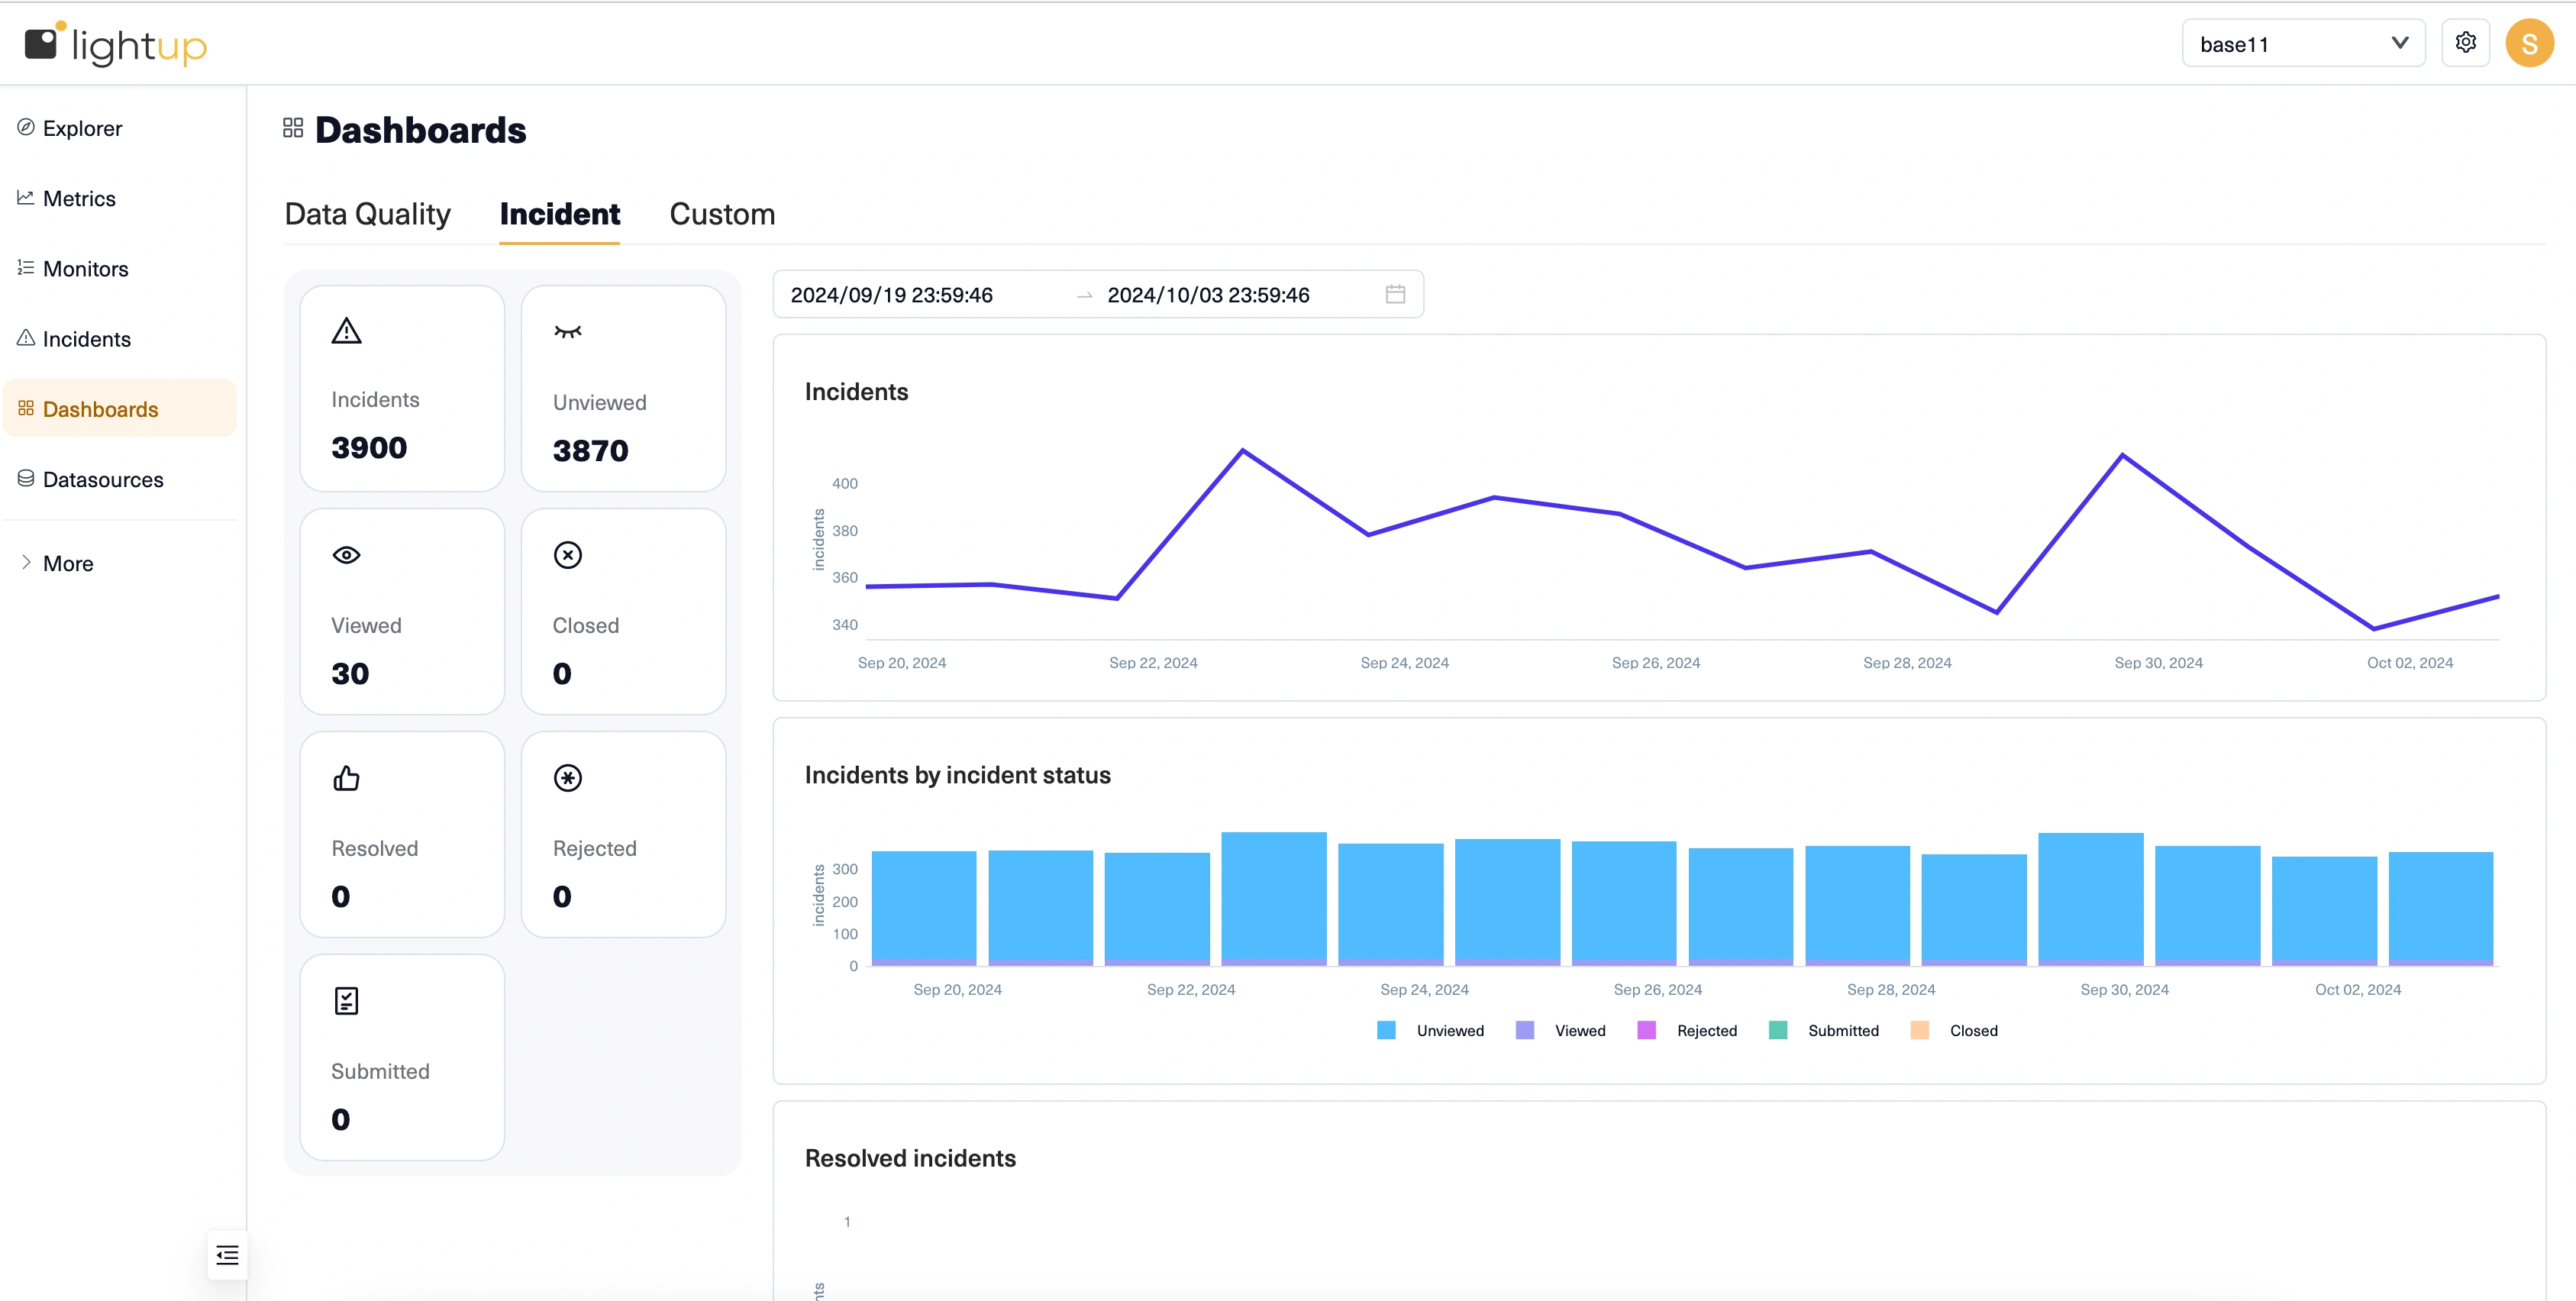
On the left, tiles indicate the number of incidents with various statuses. If the number isn't zero, the tile is also a filtered link to the Incidents list. Select a tile to open the Incidents list and display items with the indicated status. Note that Resolved is actually a validation status, so the filters have some overlap (e.g., an incident can be Submitted and Resolved at the same time).
On the right, you can specify a date range at the top, and review the following charts:
- Incidents plots the count of incidents over time.
- Incidents by incident status also shows counts over time, but as stacked bars (one per incident status). Select a status in the legend at the bottom of the chart to toggle the corresponding bars on or off. For example, if all statuses are displayed and you want to hide unviewed incidents, select Unviewed in the legend— select it again to unhide them.
- Resolved incidents plots the count of resolved incidents over time. For information about resolving incidents, see validate an incident fix.
- Incidents by severity shows counts of incidents over time as stacked bars (one per severity). Select a severity in the legend at the bottom of the chart to toggle the corresponding bars on or off.
Recurring Incident Alerts
When an incident occurs, Lightup schedules alerts to be sent to all alerting channels that have been registered for the monitor. Alerting channels are created by creating an integration. They support the following functionality:
- The integration can be configured to send the alert immediately.
- Some integrations allow the user to specify that alerts should be sent hourly, daily or weekly. This is commonly referred to as a “digest” form. An integration that uses this digest format sends a periodic (hourly, daily, or weekly) summary of the number of incidents that have started, ended or are ongoing during the period.
Updated 11 months ago