
Row by row metrics
Row by row metrics let you measure data value differences between a source table and a target table.
Note: Backfill is not configurable for row by row metrics.The system chooses a backfill duration based on aggregation interval for incremental full compare metrics.
Create a row by row metric
-
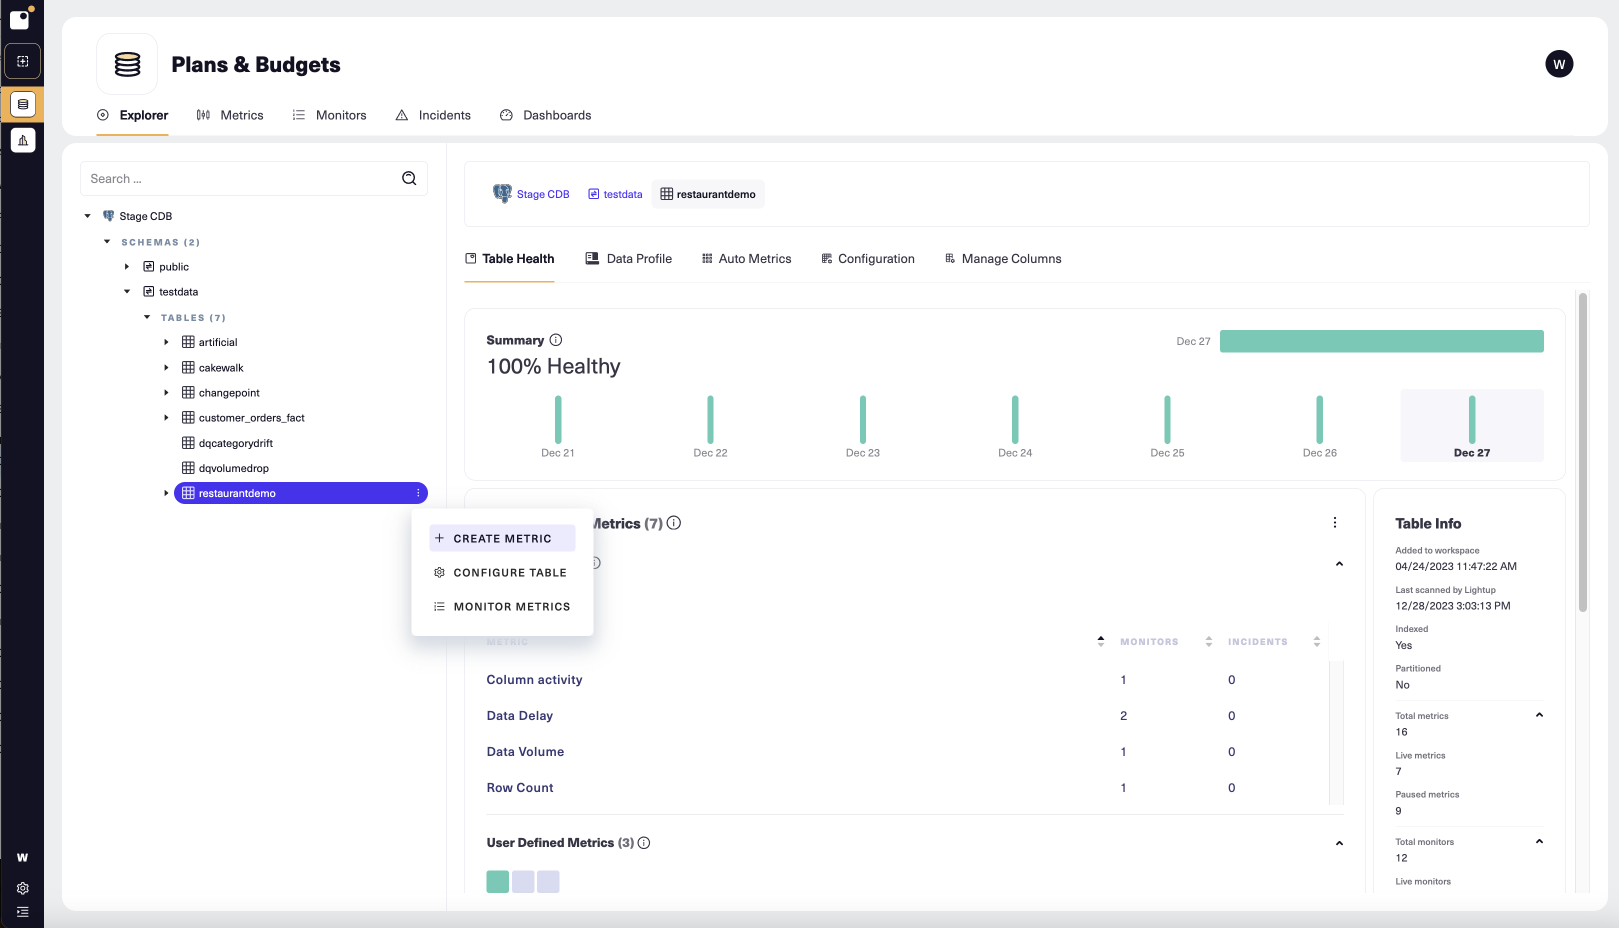
In the Explorer tree, select the data asset that you want to measure.
-
On the asset's Explorer menu select + Create Metric:
-
The metric configuration form opens. Set Metric type to Row by row.
-
Enter a Metric name.
-
By default, new metrics go Live shortly after you create them. If you want the metric to start off paused, under Metric status, set Status to Paused.
-
If desired, change the value of Quality dimension. Each data quality metric measures one dimension of data quality: accuracy, completeness, timeliness, or (if none of these applies), custom. You can sort and filter your metrics by dimension, and you can view them summarized by dimension in a data quality dashboard.
-
Select Next to proceed to Step 2 (Configure Metric).
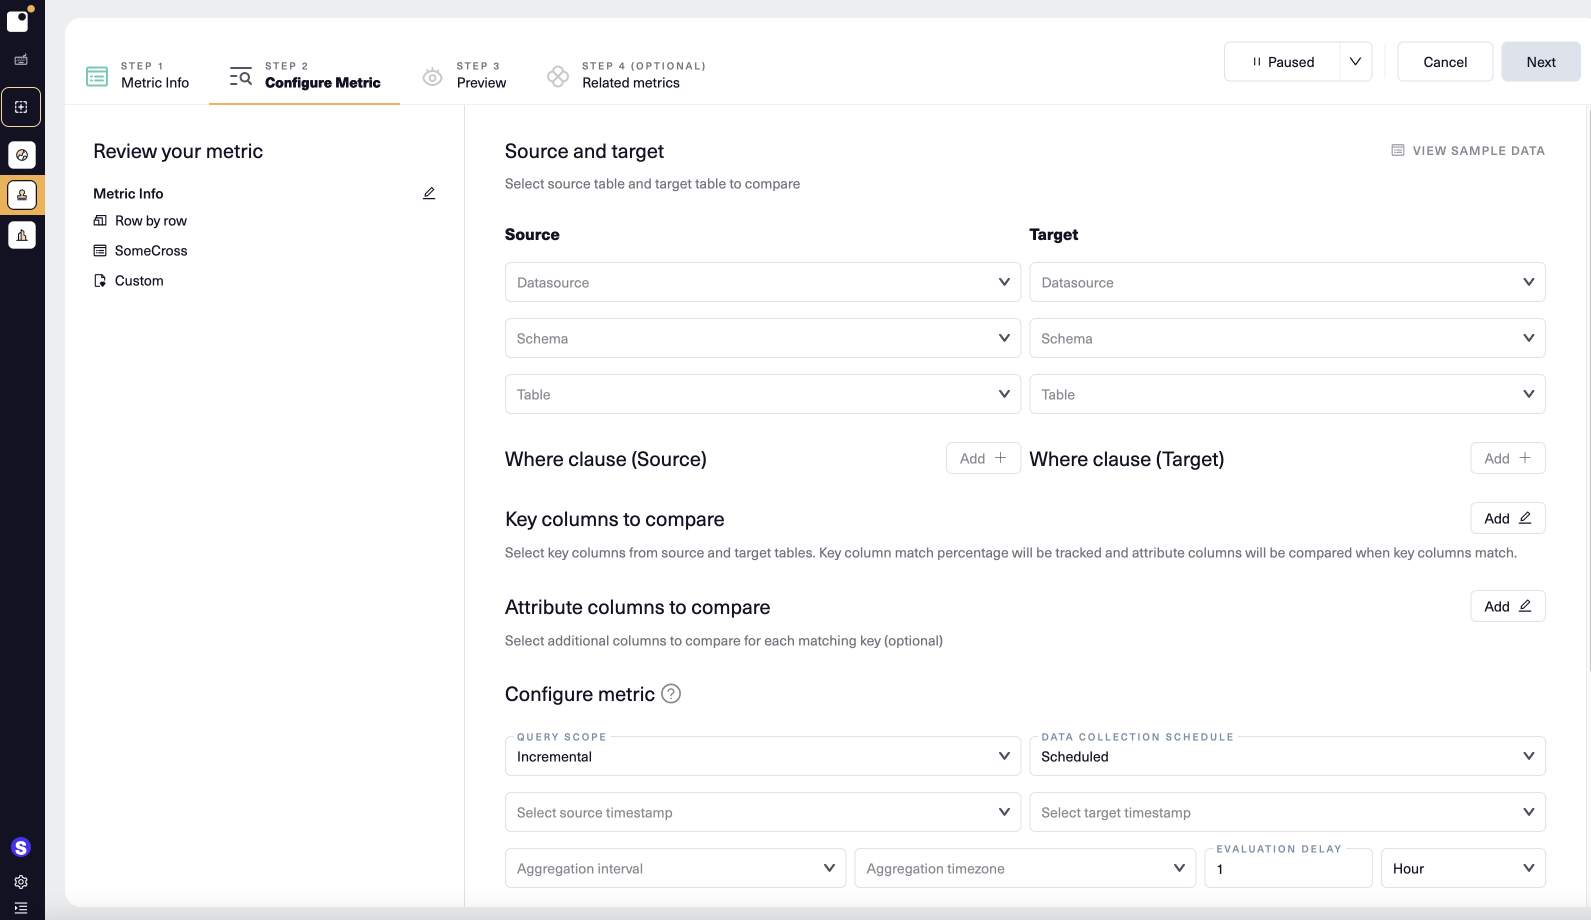
- Under Source, select a datasource, a schema, and a table. Do the same under Target. These are the tables the metric will compare.
- Choose Join type (full outer join, right outer join, left outer join)
- Optionally, add a WHERE clause below one or both tables
- Choose the Key columns to compare.
- Choose one or more pairs of key columns.
- When the metric is computed, the key columns in the source will be compared to the key columns in the target and the Match % will be displayed.
- Single pair example: For example, if you choose Customer Name as the key column in the source and Cust Name as the key column in the target, the percentage or rows where Customer Name equals Cust Name will be displayed.
- Two pair example: For example, if for the first pair you choose Customer Name (source) and Cust Name (target), and the second pair you choose Order ID (source) and Sale Id (target), the percentage of rows where Customer Name and Order ID (source) match Cust Name and Sale Id (target) will be displayed.
- If you select attribute columns, the key columns also identify the rows that will participate in the attribute column compare. For each row where the key columns match, Lightup will compare all attribute columns and display the Match %, which is the percentage of rows where the attribute columns match
- Optionally choose Attribute columns to compare.
- Under Configure metric, make selections for the various inputs. These selections mirror the selections you need to make during Table configuration, where you can find details on how to fill in these fields.
- Optionally add slices for your source and target tables. Make sure slices use the same columns in the same order.
- When you're ready, select Next at the top right corner to proceed to Step 3 and preview your metric.
Preview
Once you have configured your metric you can preview it to view a live query without creating a datapoint. If the preview doesn't work the way you want, you can select the tab for a previous step and modify the configuration as needed.
- On the Step 3 (Preview) tab, set the date range for the preview, then select Preview.
- When you're happy with the result, select Next to continue.
You don't have to preview your metric— you can just click Next to proceed to Step 4 (Related metrics).
Add Related metrics
You add related metrics at Step 4 of metric configuration. Related metrics always appear in the list of metrics available during incident analysis.
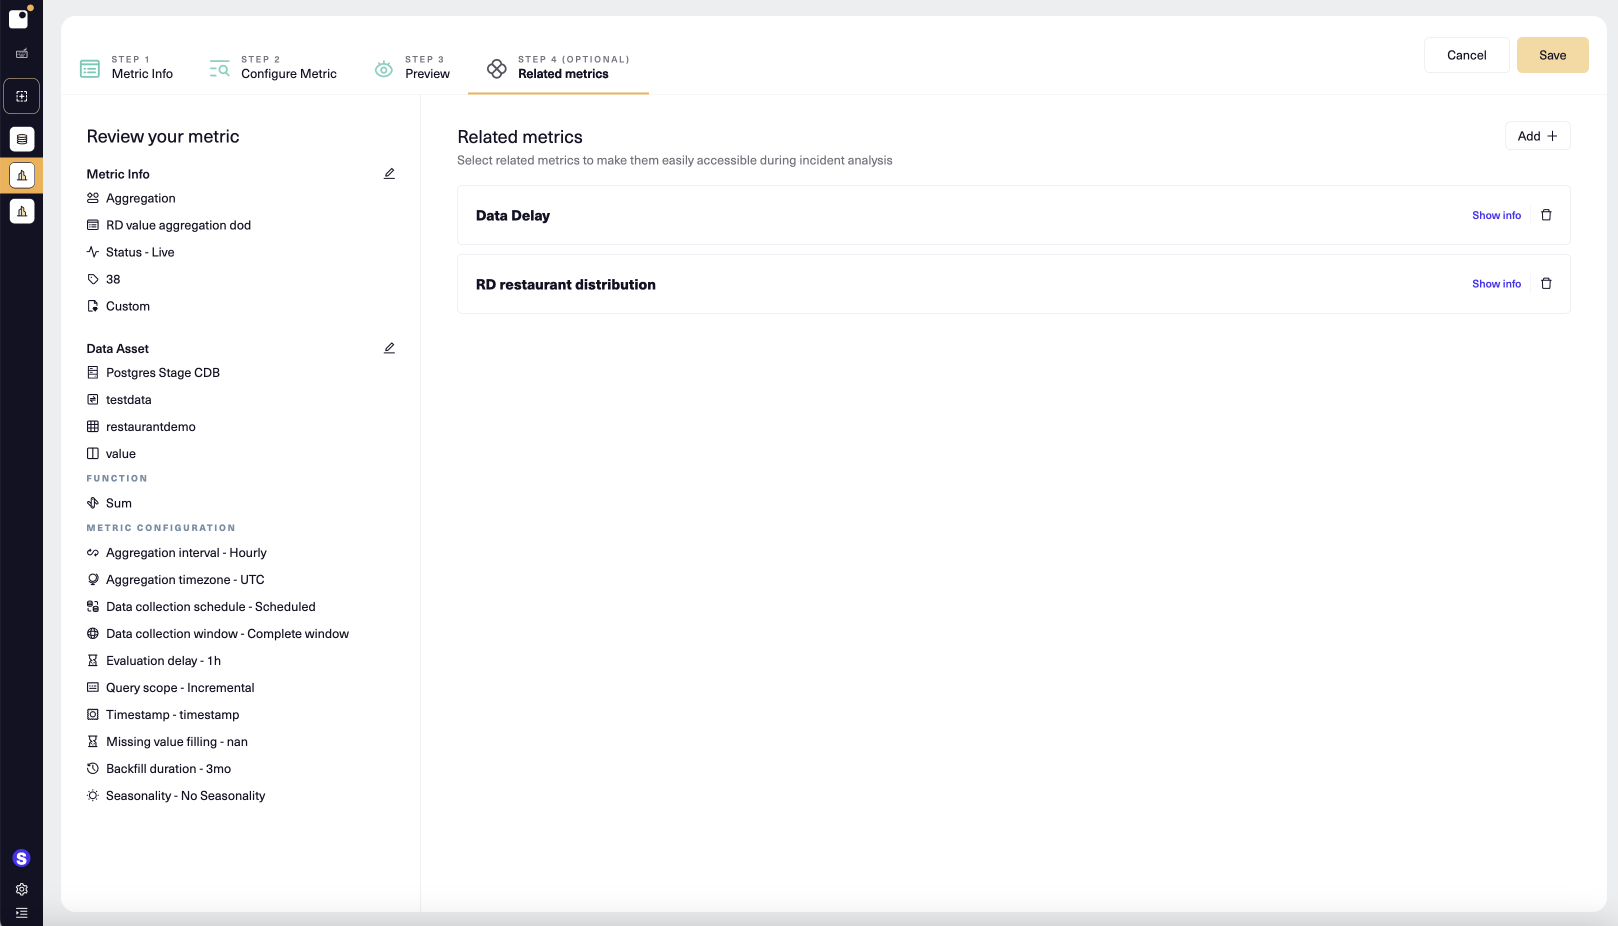
- To add a related metric, select Add + and then choose a metric in the listbox that appears.
- Select Show info inside a related metric to display the metric's ID and data asset(s).
- When you've added the related metrics you want, select Create (for a new metric) or Save.
- During incident analysis of the metric, any related metrics appear in the metrics listed on the left. You can then easily add them to the Metrics of interest, making the metric chart available within the incident.
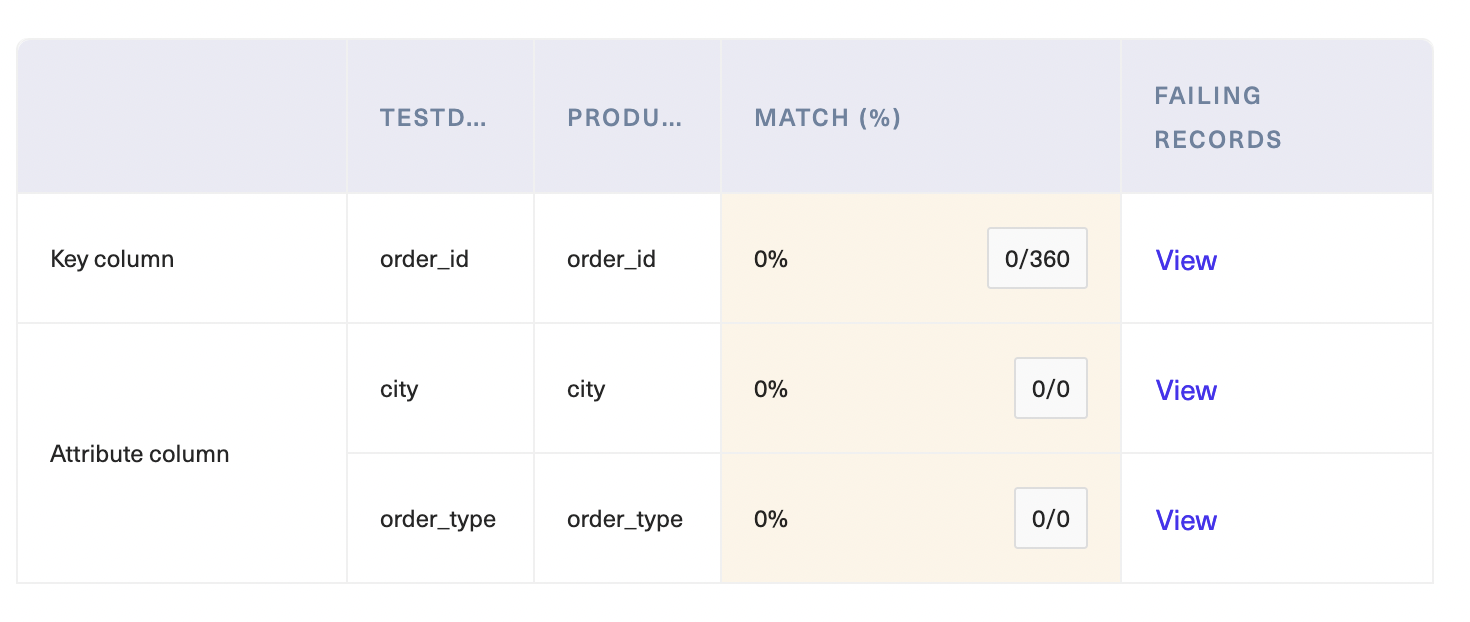
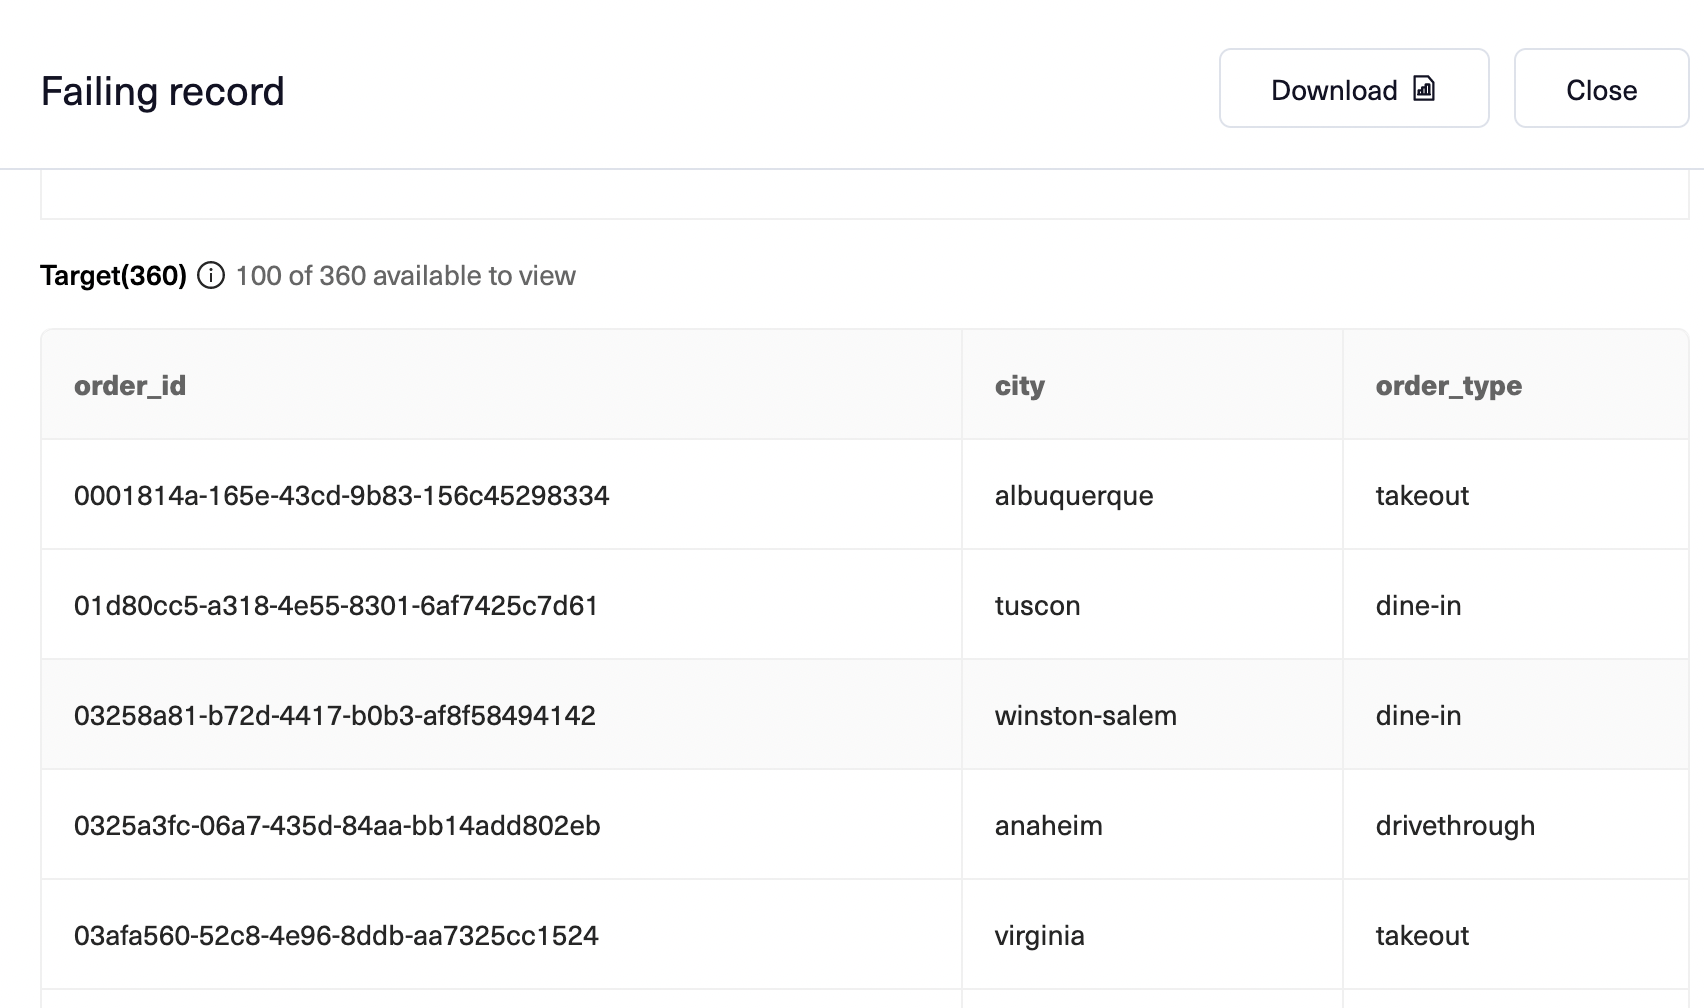
Failing Records
When the metric detects a difference between source and target, in the Explorer you can see additional information about the source and target tables to help with triaging. Clicking on the "View" link will show you additional details of the records where there is a mismatch between source and taget.
You can also download the failing records as a CSV file. The CSV file has columns as follows:
Source_key_0_keycolumn
Source_attr_0_colmun0
Source_attr_1_column1
Target_key_0_keycolumn
Target_attr_0_colmun0
Target_attr_1_column1
column0_check (with values TRUE or FALSE)
column1_check with values TRUE or FALSE)
Size restrictions and implications
Lightup can handle up to rows count * row size (based on columns) up to 5GB for row by row comparison metrics. If the total memory occupied by both the source and target rows to be compared exceeds a memory allocation for the row by row compare collector service, Lightup will pause the metric.
Updated 11 months ago