
Incident dashboards
Each workspace has an Incident dashboard with an overview of all the workspace's incidents.
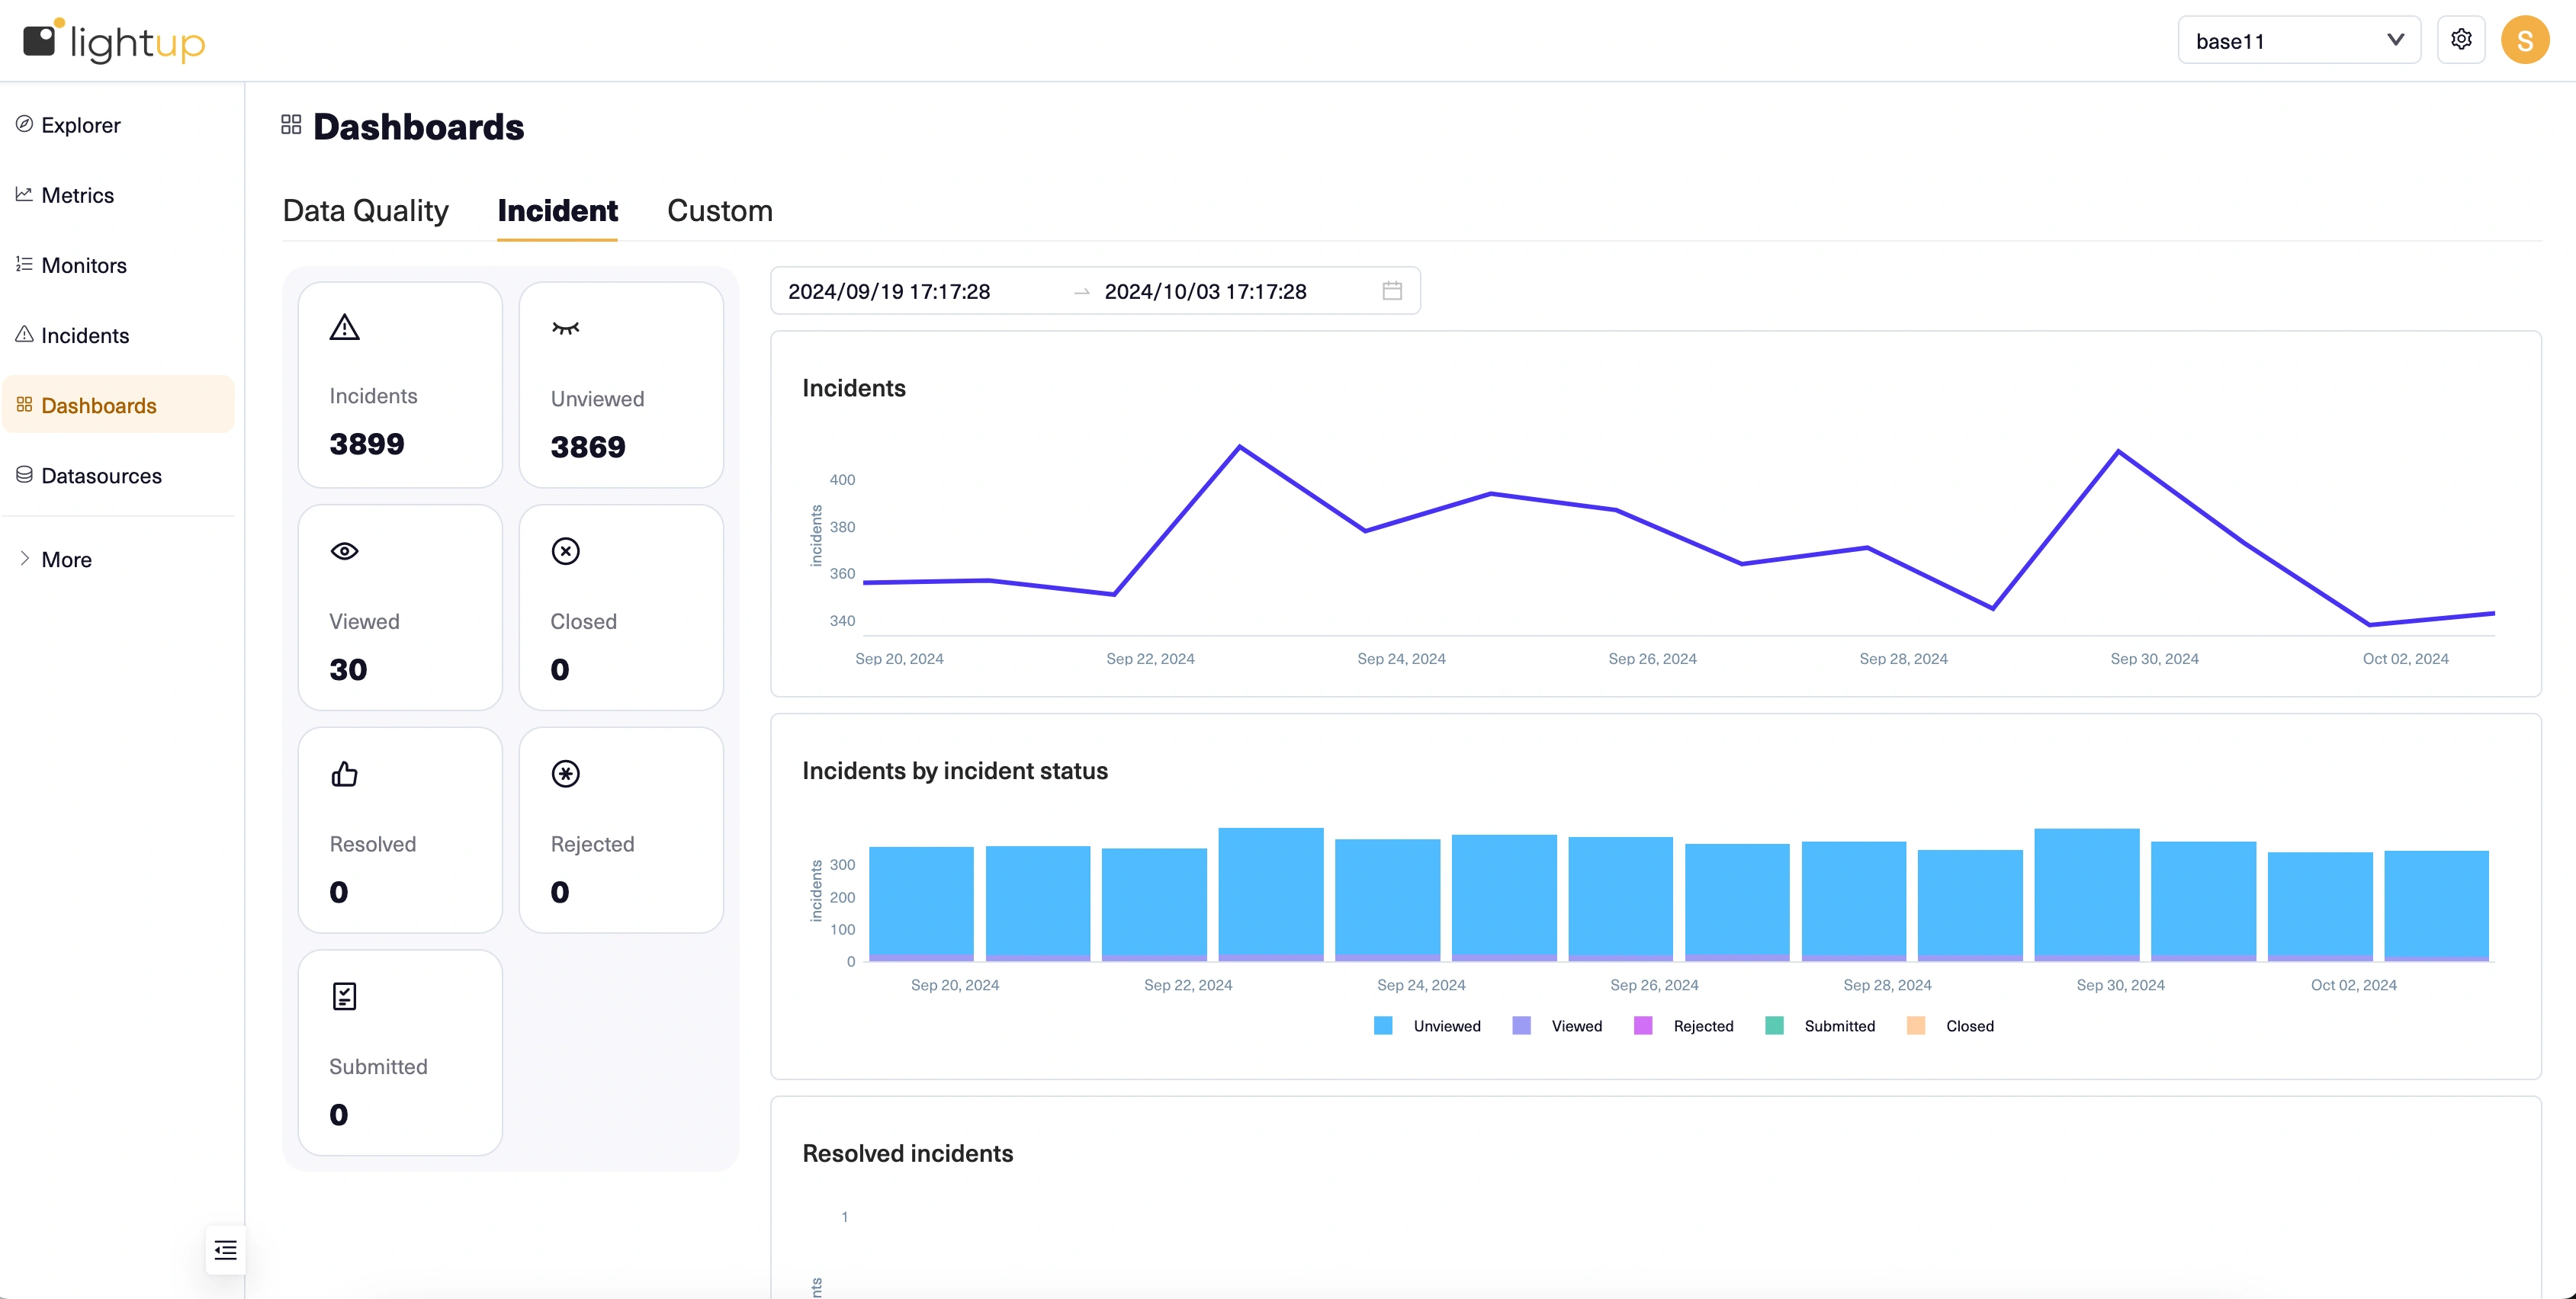
On the left, tiles indicate the count of incidents with various statuses. If the count isn't zero, the tile is also a filtered link to the Incidents list.
- Select a tile to open the Incidents list and display items that have the corresponding status.
- Note that Resolved is actually a validation status, so the filters have some overlap (e.g., an incident can be Submitted and Resolved at the same time).
On the right, you can specify a date range at the top and then review charts of the workspace's incidents:
- Incidents plots the count of incidents over time.
- Incidents by incident status also shows counts over time, but as stacked bars (one per incident status). Select a status in the legend at the bottom of the chart to toggle the corresponding bars on or off. For example, if all statuses are displayed and you want to hide unviewed incidents, select Unviewed in the legend— select it again to unhide them.
- Resolved incidents plots the count of resolved incidents over time. For information about resolving incidents, see validate an incident fix.
- Incidents by severity shows counts of incidents over time as stacked bars (one per severity). Select a severity in the legend at the bottom of the chart to toggle the corresponding bars on or off.
Updated 11 months ago
Did this page help you?