
Create a monitor from Explorer
The simplest way to create a monitor is from Explorer, by using the Monitors menu on the metric chart. The Monitors menu's exact location and label depend on several factors.
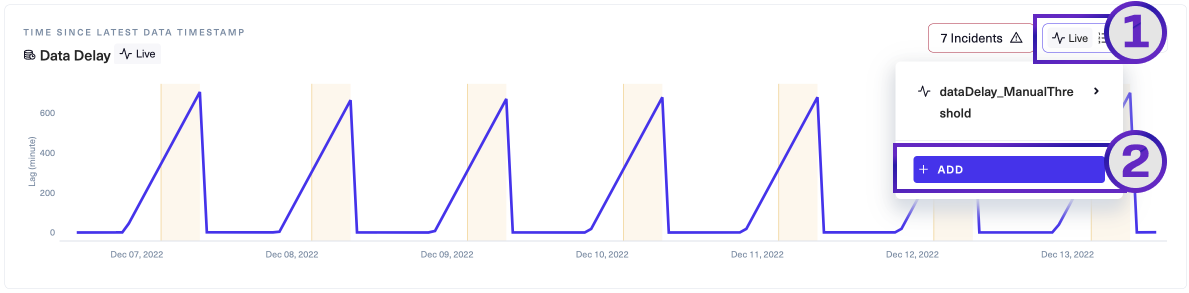
- For a non-sliced metric, the Monitors menu is between the Expand Incidents button and the Metric menu (three vertical dots), in the upper right of a chart.
- For a sliced metric, the Monitors menu is on the upper right of the page, just to the left of the Metric menu.
- If there are no monitors yet, the Monitors menu will be labeled 0 Monitors.
- If there are multiple monitors, the Monitors menu will be labeled with the number of monitors, e.g. 2 Monitors.
- If there is one monitor, the Monitors menu will be labeled with the status of that monitor - Live, Paused, or Training.
Add a monitor
- With the metric open in Explorer, select its Monitors menu.
- Choose + ADD.
Lightup opens the Add monitor modal, which usually has two tabs: Threshold and Anomaly Detection (both tabs depicted below).
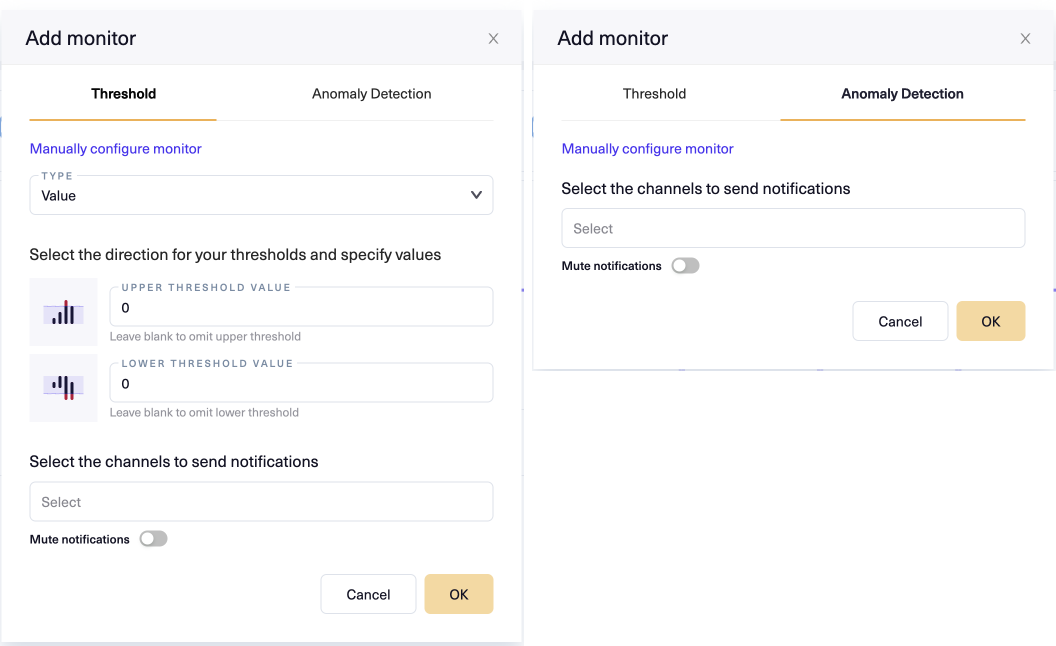 Note that some metrics do not support both tabs, because they don't support both underlying monitor types. For example, Compare metrics only support manual thresholds, so the Anomaly Detection tab does not appear in the Add Monitor modal for them.
Set monitor thresholds manually
To set the monitor thresholds manually, choose the Threshold tab and set at least one threshold value (you can set both).
- Set the Upper Threshold Value if you want to specify the max acceptable value for your metric. Any metric datapoints above this value will generate an incident. If you don't set an upper threshold you must set a lower threshold.
- Set the Lower Threshold Value if you want to specify the min acceptable value. Any metric datapoints below this value will generate an incident. If you don't set a lower threshold you must set an upper threshold.
- Set Type to indicate what the monitor should check against thresholds.
- Choose Value to check that metric values remain within thresholds.
- Choose Percentage Change to check that the percent change in the metric value calculated period over period remains within thresholds. You must then set the period - choose one of day over day, week over week, or sample over sample. In this case, the threshold values specify percentages. In other words, if you set Period to day over day and set Upper Threshold to 20, an incident will be generated if from one day to the next, the change in metric value is greater than 20%.
- Choose Change to check that the absolute change in the metric value calculated period over period remains within thresholds. You must then set the period: day over day, week over week, or sample over sample.
Anomaly monitor
Choose Anomaly Detection if you want Lightup's anomaly monitoring to detect incidents when the value of the metric is outside of its historical range. The monitor will train using metric values from the last month, and will generate incidents if metric values are found to be anomalous, based on that training.
Manually configure the monitor
Default values for these settings vary by metric type. To set them yourself, click Manually configure monitor at the top, then follow the steps to create a monitor manually.
Set up notifications
If you want your monitor to send notifications, you can select one or more notification channels where they should be sent. A channel needs to be set up already before it appears as an option. For details on setting up an integration for notifications, see Add an integration.
Updated 11 months ago