
Auto metrics
Auto metrics provide a simple way to get started understanding your data quality. When you add data assets, you can enable their auto metrics. Lightup makes it possible for you to enable auto metrics at various levels in your data hierarchy, selectively or in bulk.
There are two kinds of auto metrics: metadata metrics that query system data, and deep auto metrics that query your business data.
Metadata metrics
Metadata metrics query system data about your schemas, tables, and columns. Because they don't query your business data, you can enable metadata metrics without configuring your tables. Not all datasources support each metadata metric, and tables support some metadata metrics that views do not. In some datasources metadata metrics are approximate or not updated frequently unless there are table-level operations (such as VACUUM).
Metadata metrics don't have history, so after you enable one you'll want to wait for sufficient datapoints to be collected before you add and train any monitors for it.
Two metadata metrics— Table Activity and Column Activity— are event-based: they expose system events that are detected during schema scans (both scheduled and manual). These activity metrics create datapoints that sum the system events detected by schema scans since their last data collection. Note that if multiple changes to the data asset occur between schema scans, some changes might not be detectable as events. For example, if a table is added and then dropped and no scan occurs between the two events, neither event is detectable by the Table Activity metric because the schema has the same tables before and after the events. However, if a table is added and a different table is dropped, both events are detectable.
Deep auto metrics
Deep auto metrics query your business data, providing more meaningful data quality information, but they can't be enabled until you configure the data asset. Deep auto metrics have history so you can add monitors to them as soon as you're ready.
Auto Metrics require the tables to be configured first before enabling these metrics. If the table has not been configured yet, there will be a toggle switch and/or gear icon next to the table name. Follow the steps in this doc to configure the table
Schema auto metrics
Schemas support one auto metric: Table Activity, a metadata metric that measures tables added, altered or dropped.
To enable Table Activity for a schema, select the schema's datasource in the Explorer tree, and then on the Manage Schemas tab, in the row for the schema turn the Activity toggle on.
Table auto metrics
| Auto metric | Type | What it measures |
|---|---|---|
| Data delay | Deep metric | Minutes between the latest timestamp of the designated column and the time that Lightup runs the query |
| Data volume | Deep metric | Amount of data loaded into the table, based on the aggregation grouping and designated timestamp column |
| Column activity | Metadata metric | Columns added, altered (data type change), or dropped |
| Update delay | Metadata metric | Time since the last data write |
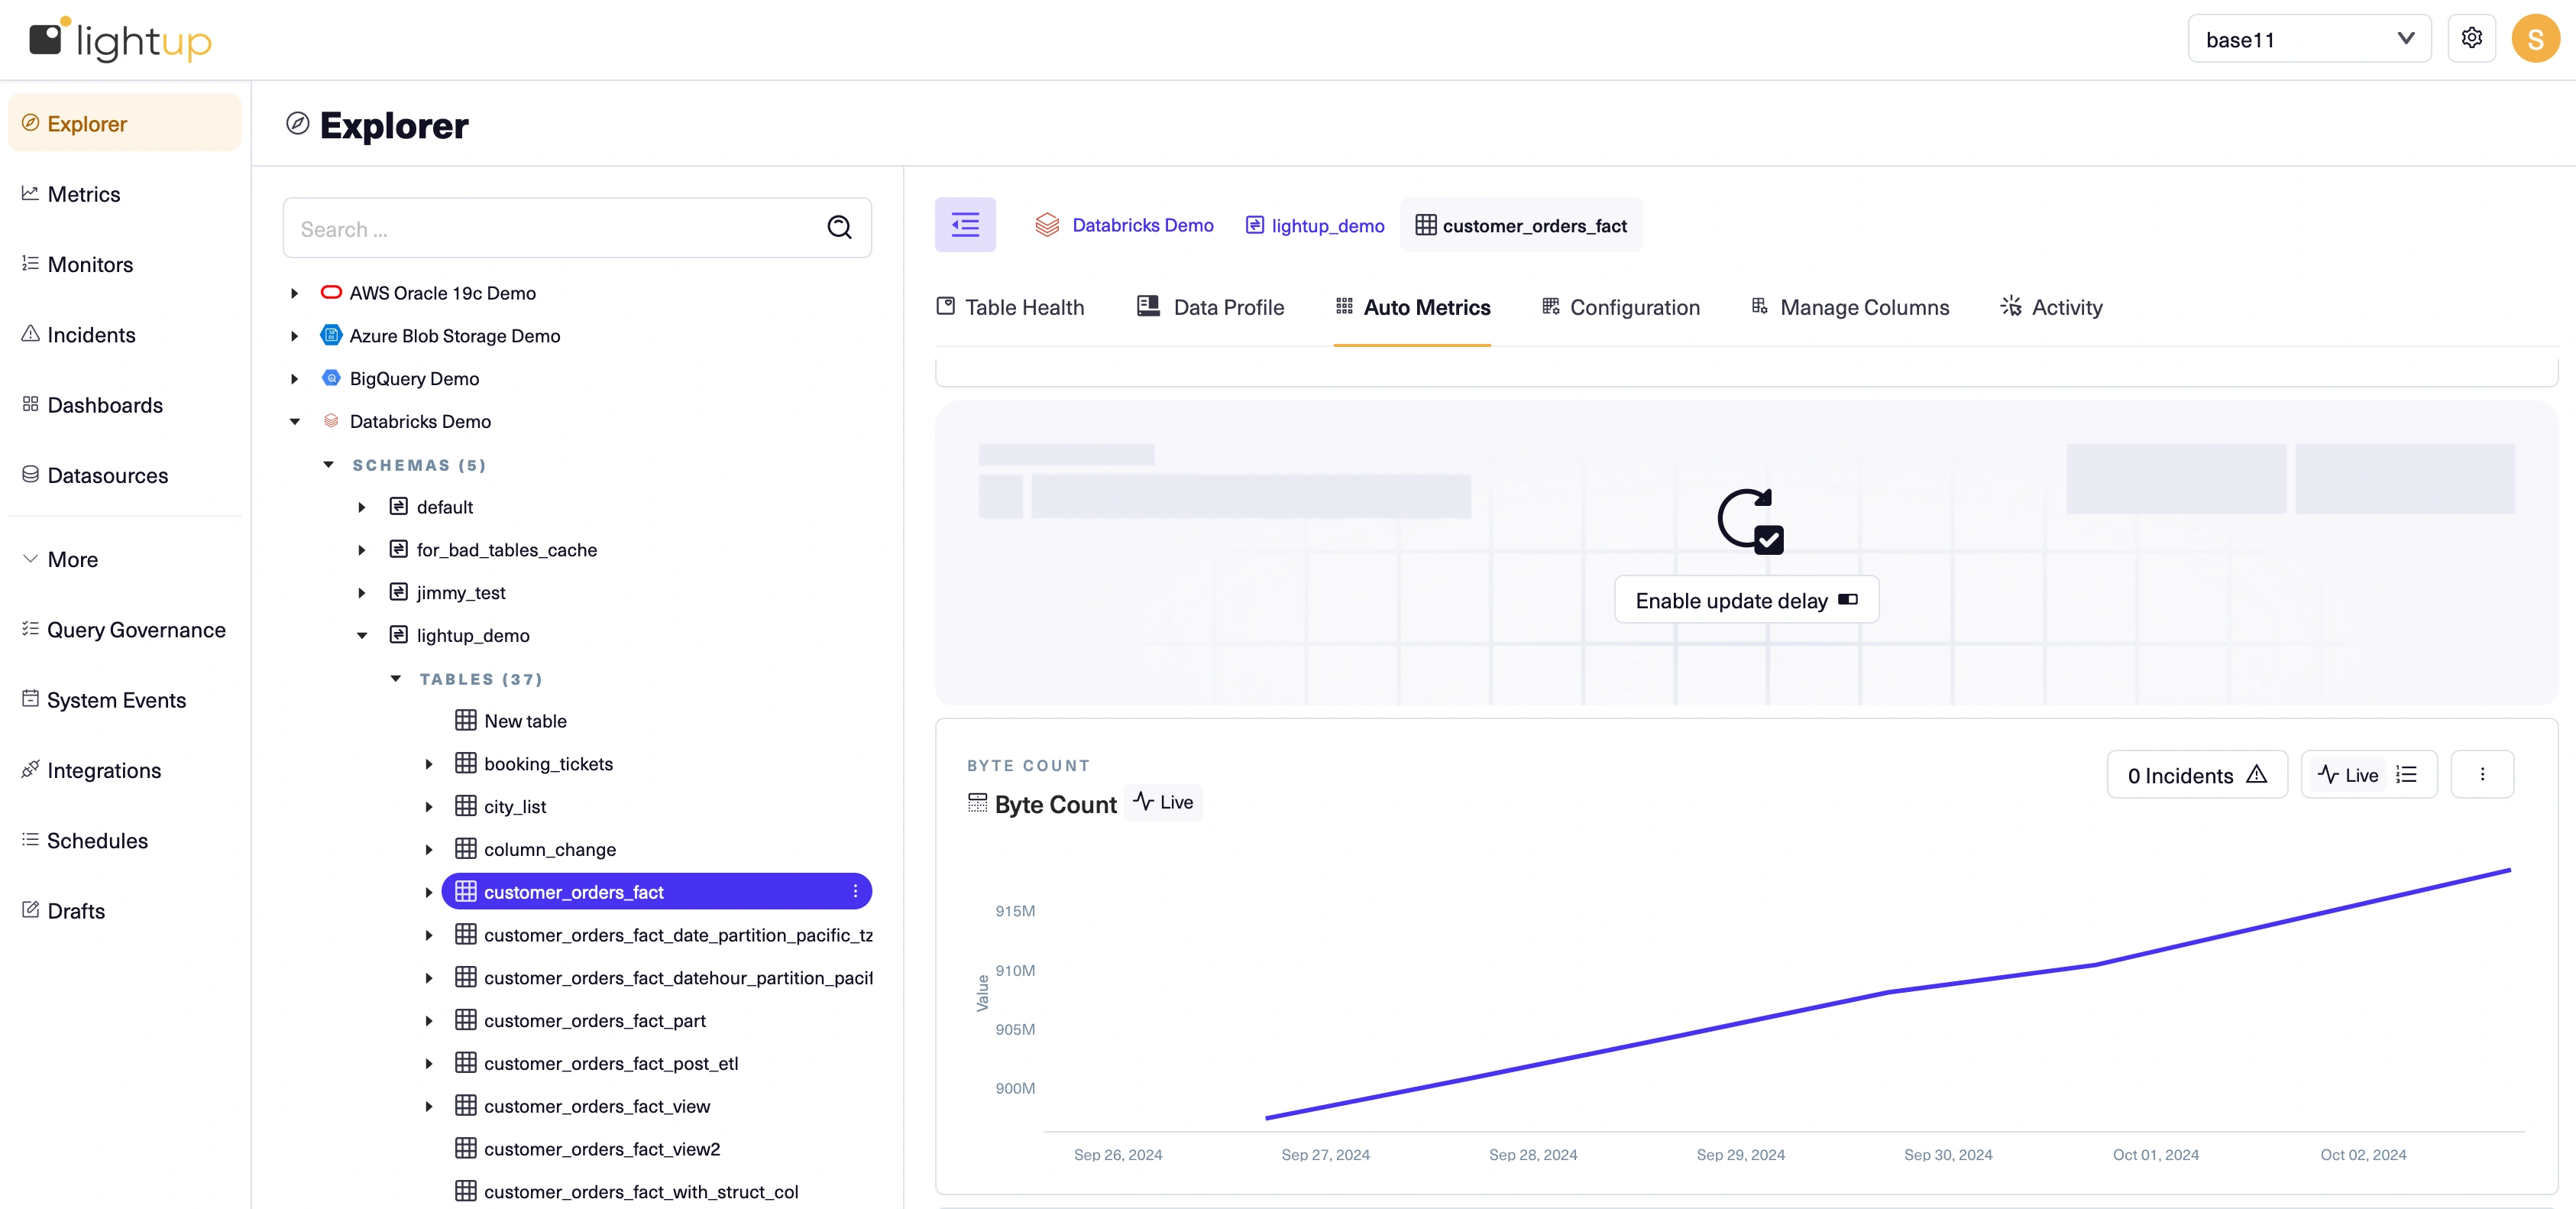
| Row count/Byte count | Metadata metric | Total number of rows or bytes (support depends on datasource) |
You can select a table in your Explorer tree, then use the Auto Metrics tab to enable and work with its auto metrics (or configure the table if it's not configured yet).
Column auto metrics
| Auto metric | What it measures |
|---|---|
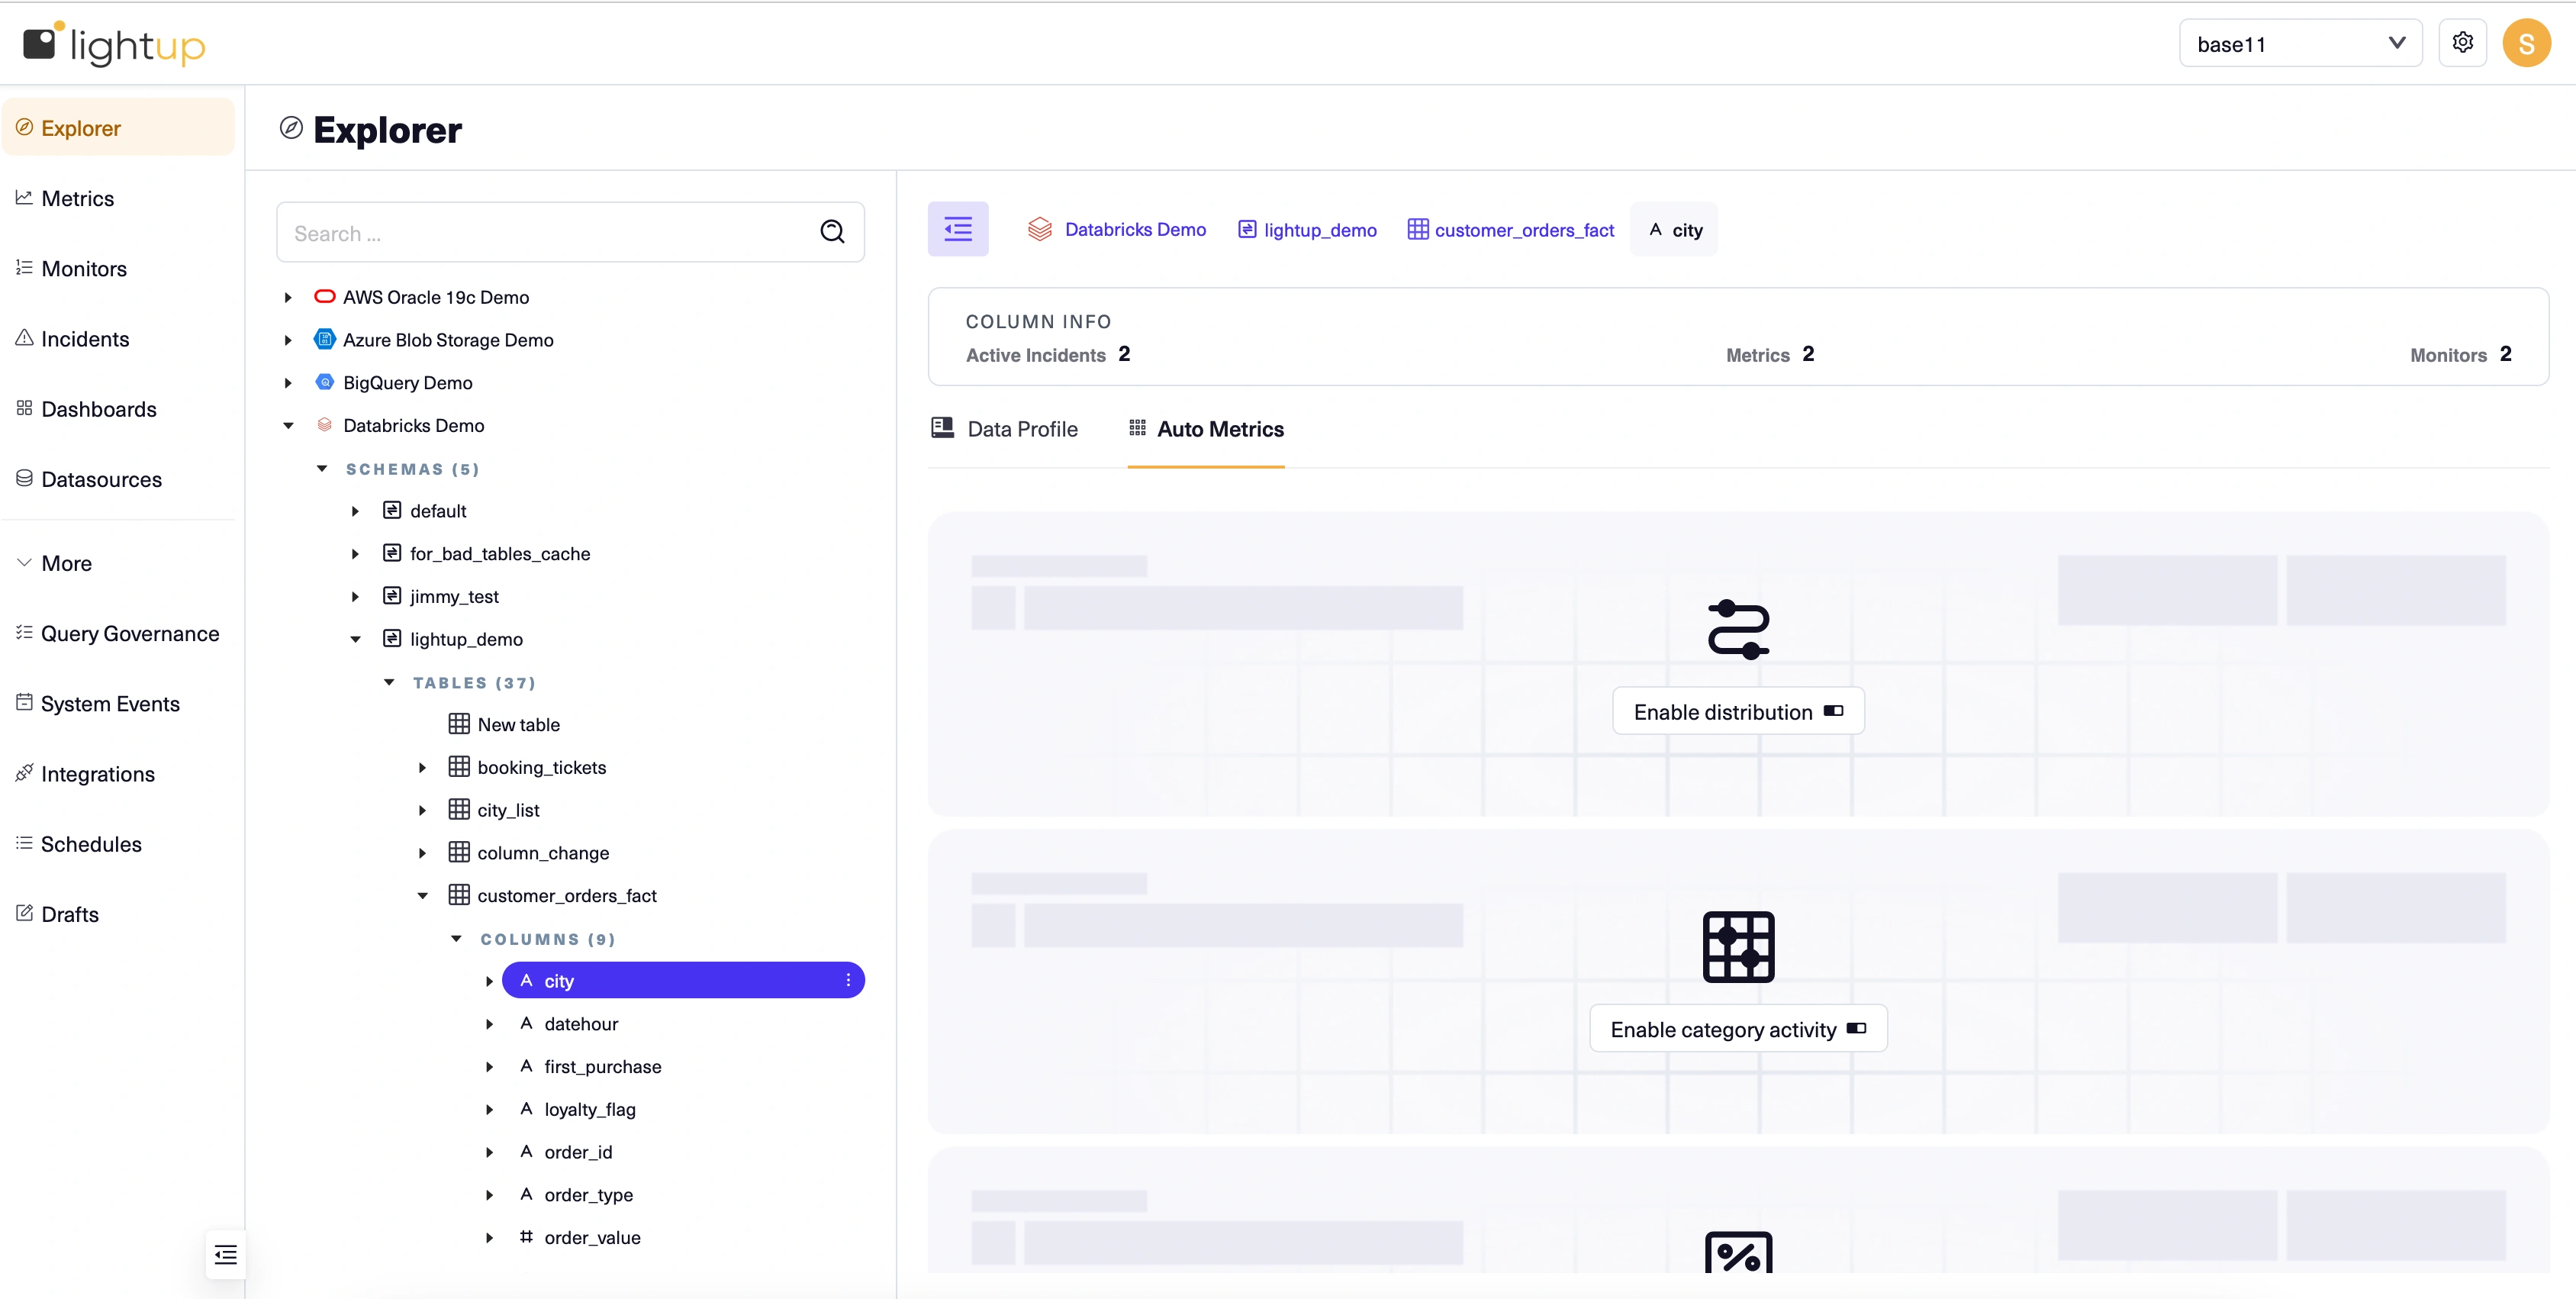
| Category activity | Added or deleted distinct values. Not available in tables with Full Table query scope. |
| Distribution | The distribution of distinct values. |
| Null percent | The percentage of null values. |
You can select a column in your Explorer tree, then use the Auto Metrics tab to enable and work with its auto metrics (or configure the column if it's not configured yet).
Updated 11 months ago