
Review query history
Whenever a metric query runs, it is saved in the metric's query history. Metric queries run during data collection and when you preview metrics. You can review the query history for a datasource or for a metric.
Each item in the query history contains a query name that you can click to review the SQL that ran, as well as the time it started running, its duration, and that status of the query.
View a datasource's query history
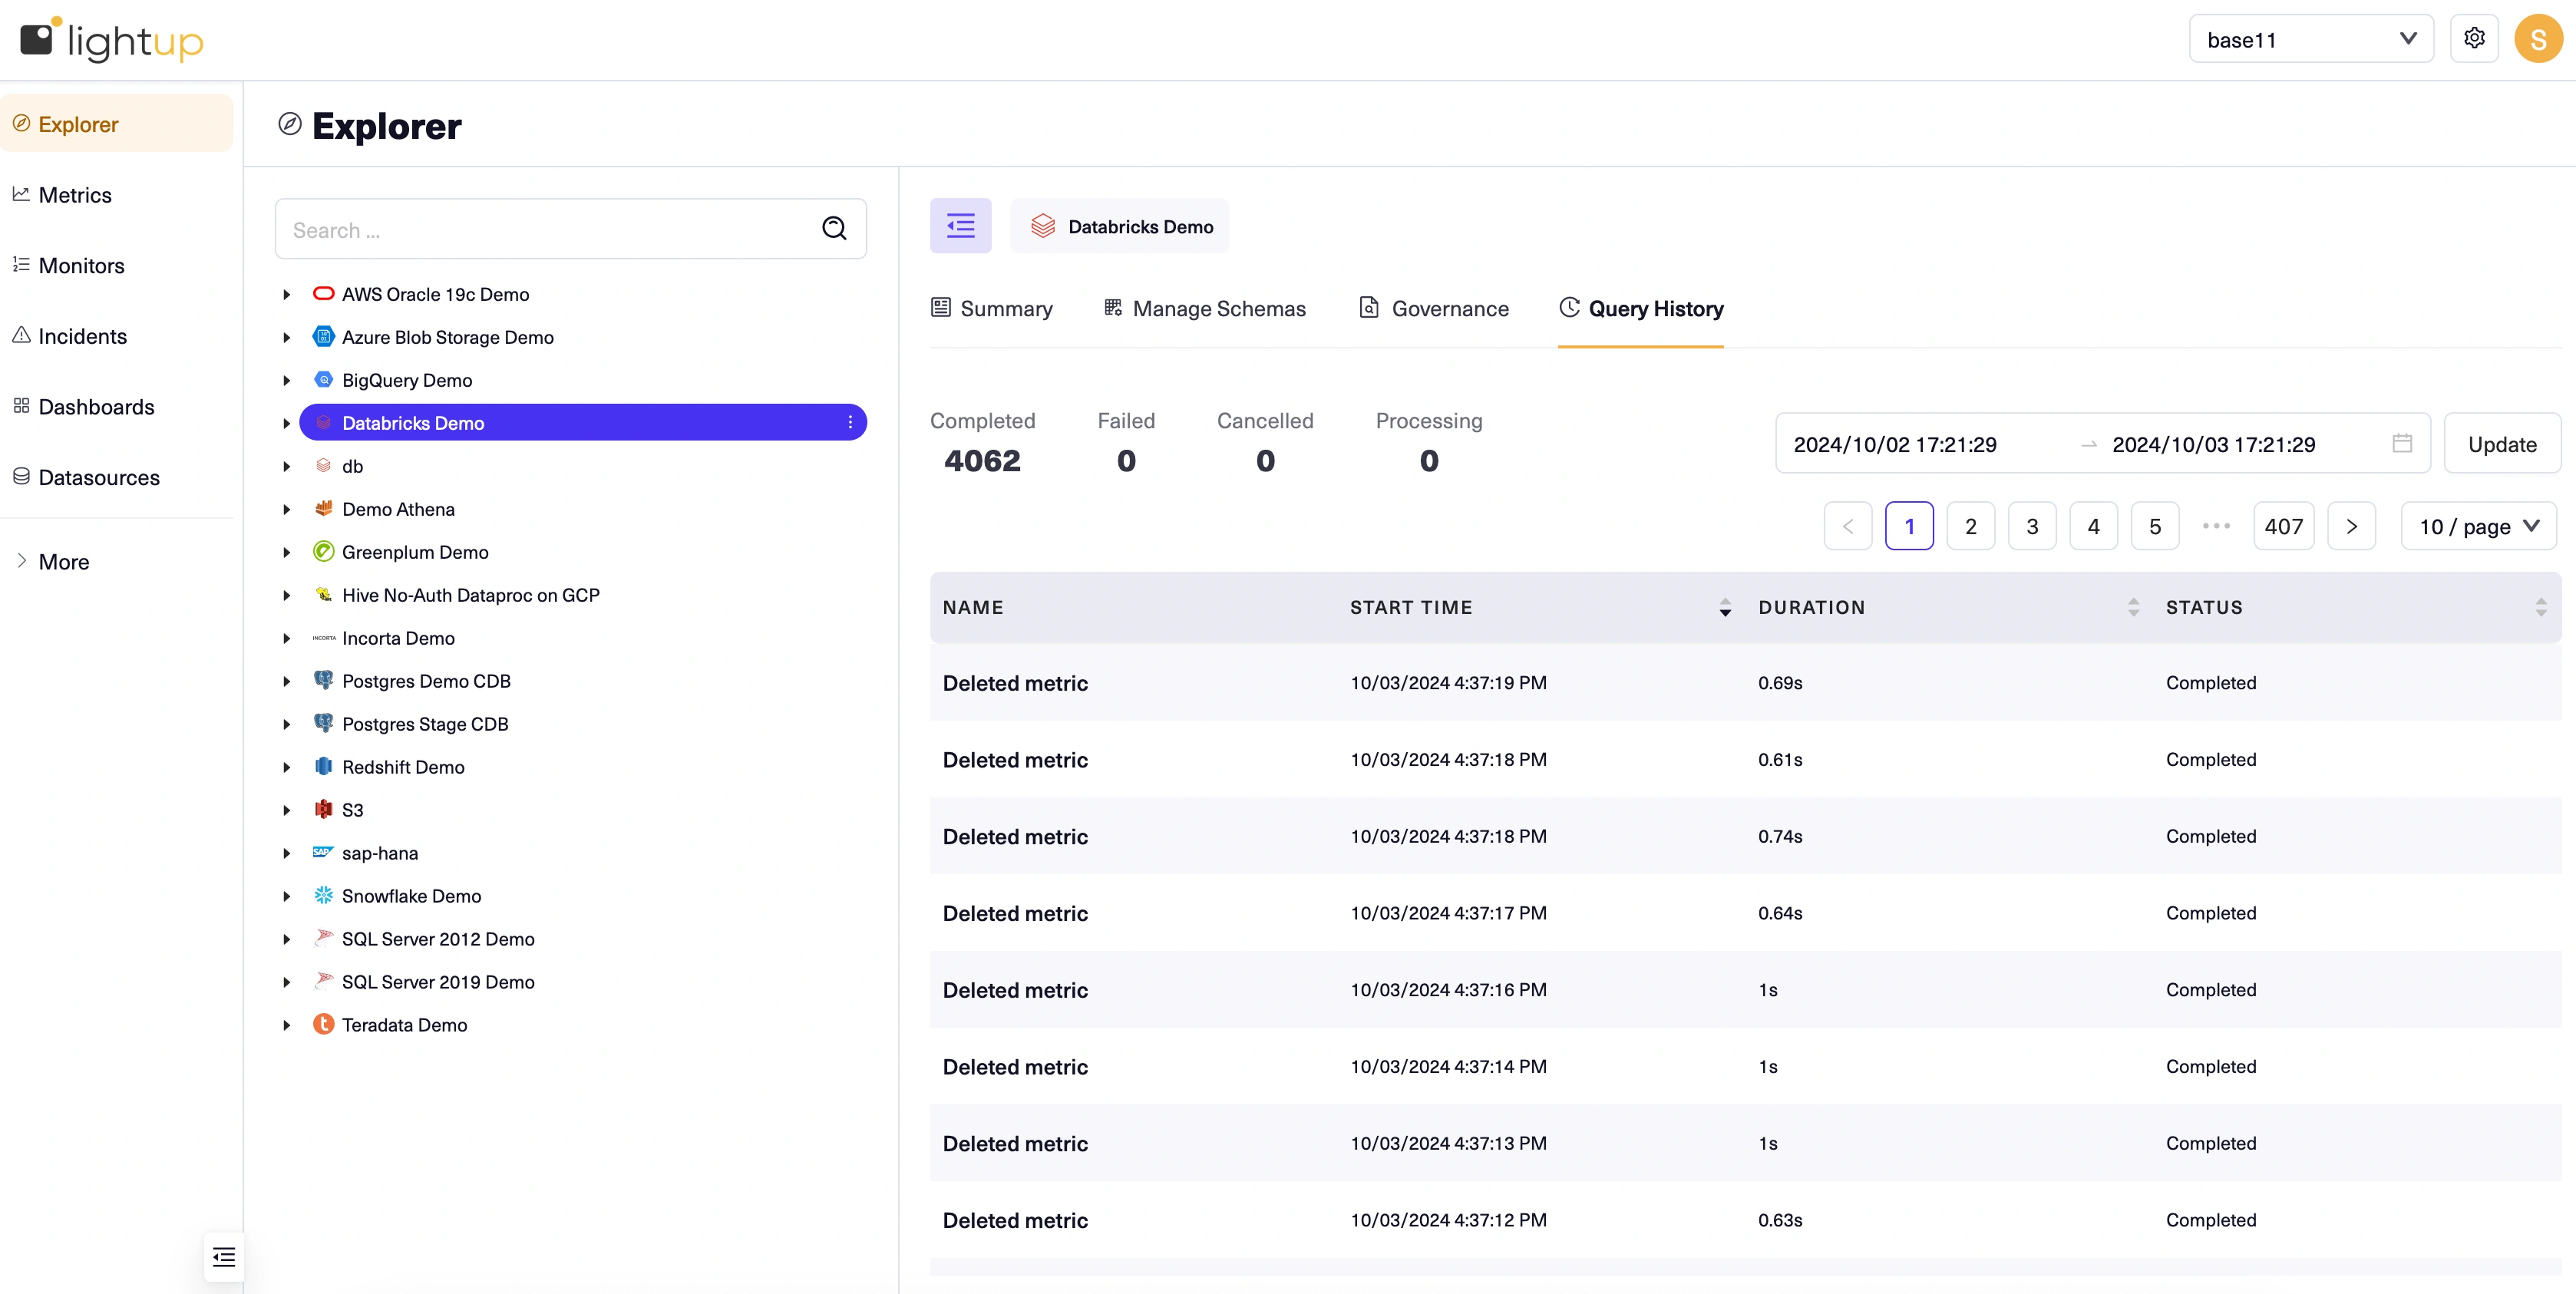
- In explore navigate to a datasource and go to the tab named Query History .
- A paginated list displays queries for the selected datasource that ran in the last 24 hours. A summary at the top tells the number of queries completed, failed, cancelled, or currently processing.
Query details
In the list, click a query's name to open the query details.
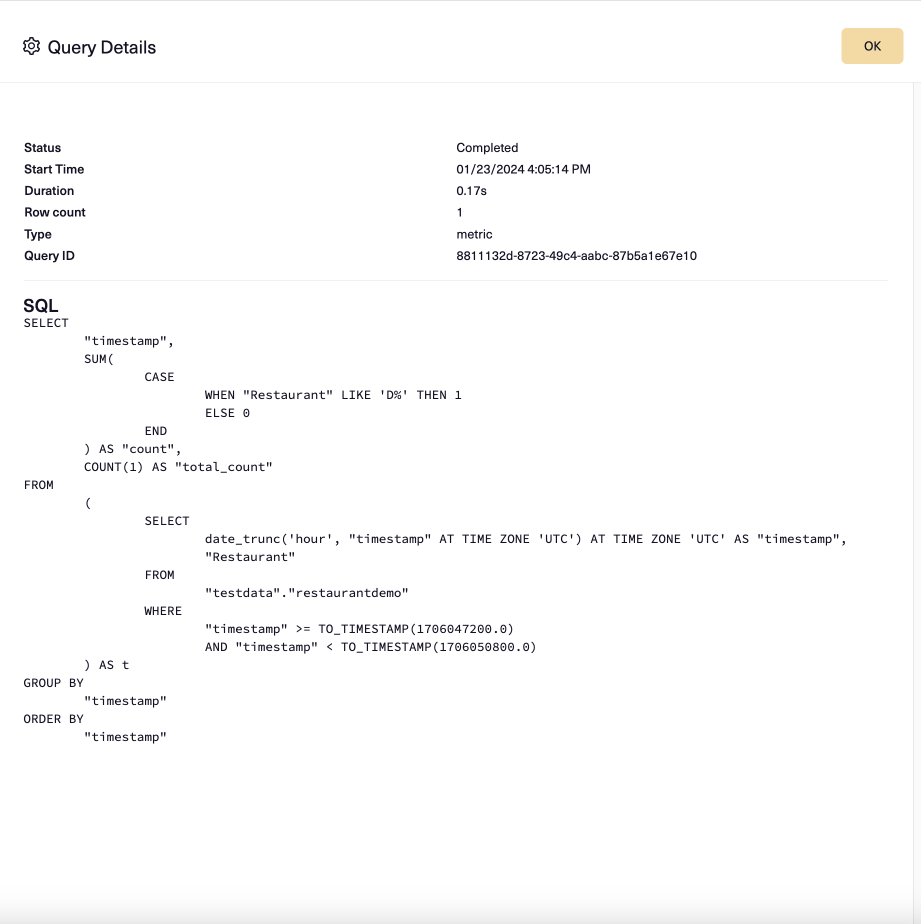
Most of the fields at the top are also available as columns in the query history list. Note that Type indicates whether the query was run for metric collection or for a preview.
Metric query history
You can open a metric's query history in several places:
- On the Preview tab of a metric that's been live at some point in the past 24 hours.
- With a metric selected in Explorer, on the Metric menu.
- In an incident's Chart tab, on the metric's menu.
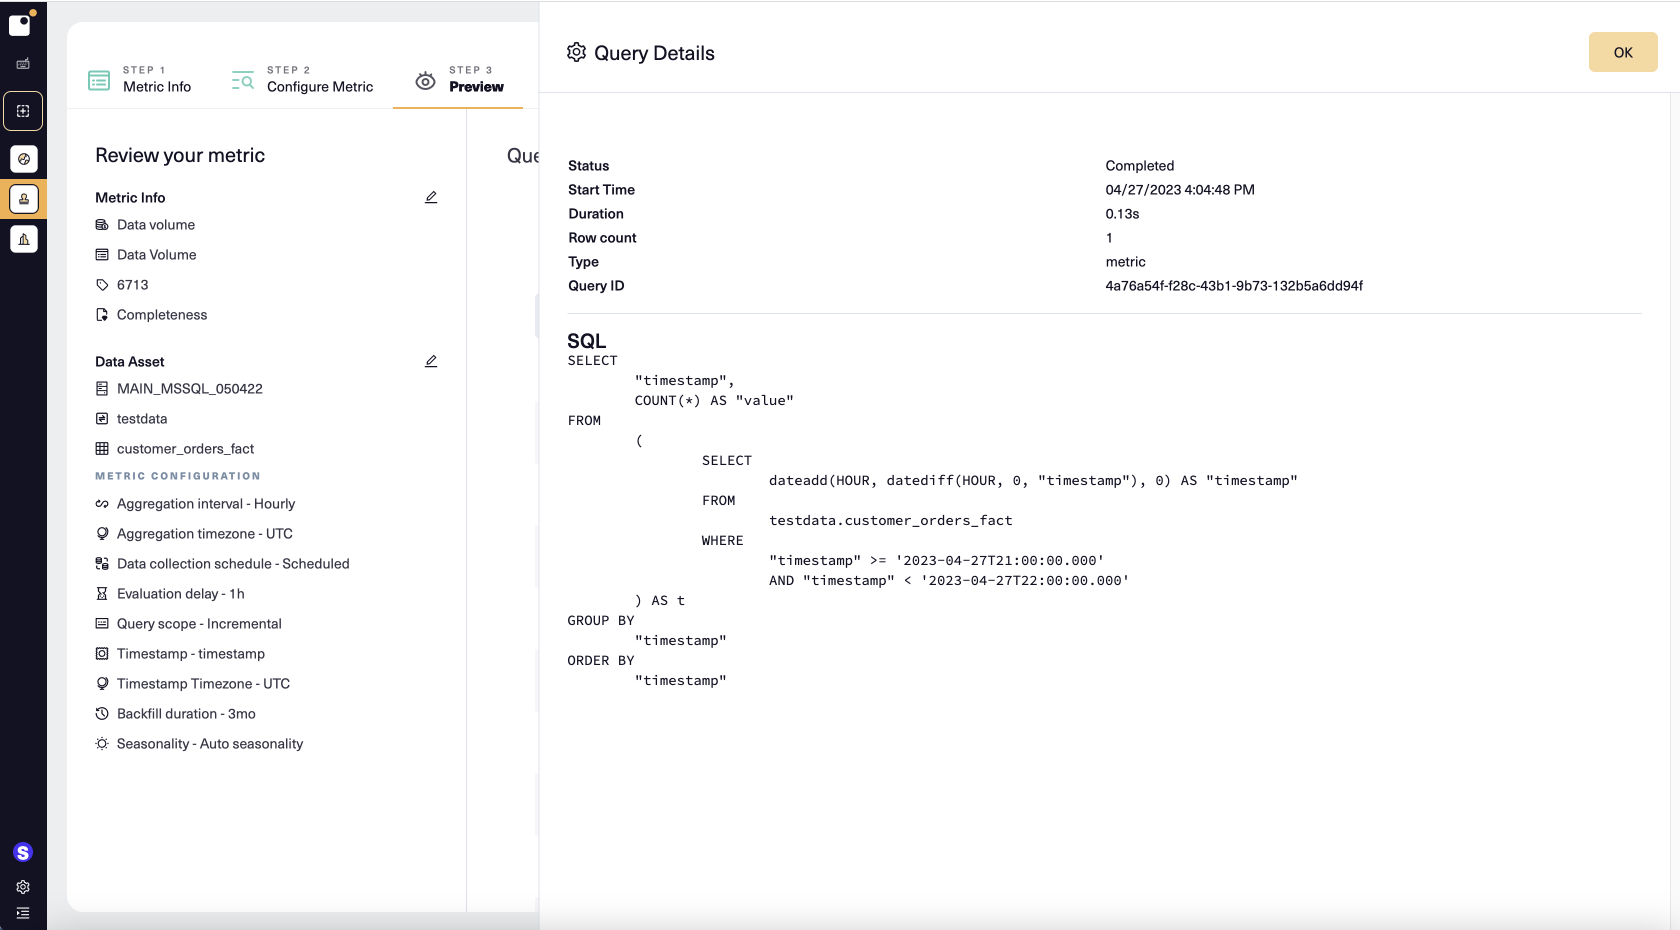
Note that the Query History form for a metric is slightly different from the form for a datasource: because all the queries are for the same metric, the Name column is replaced with a Details column. You can click Query Details in any row to open the details for that query.
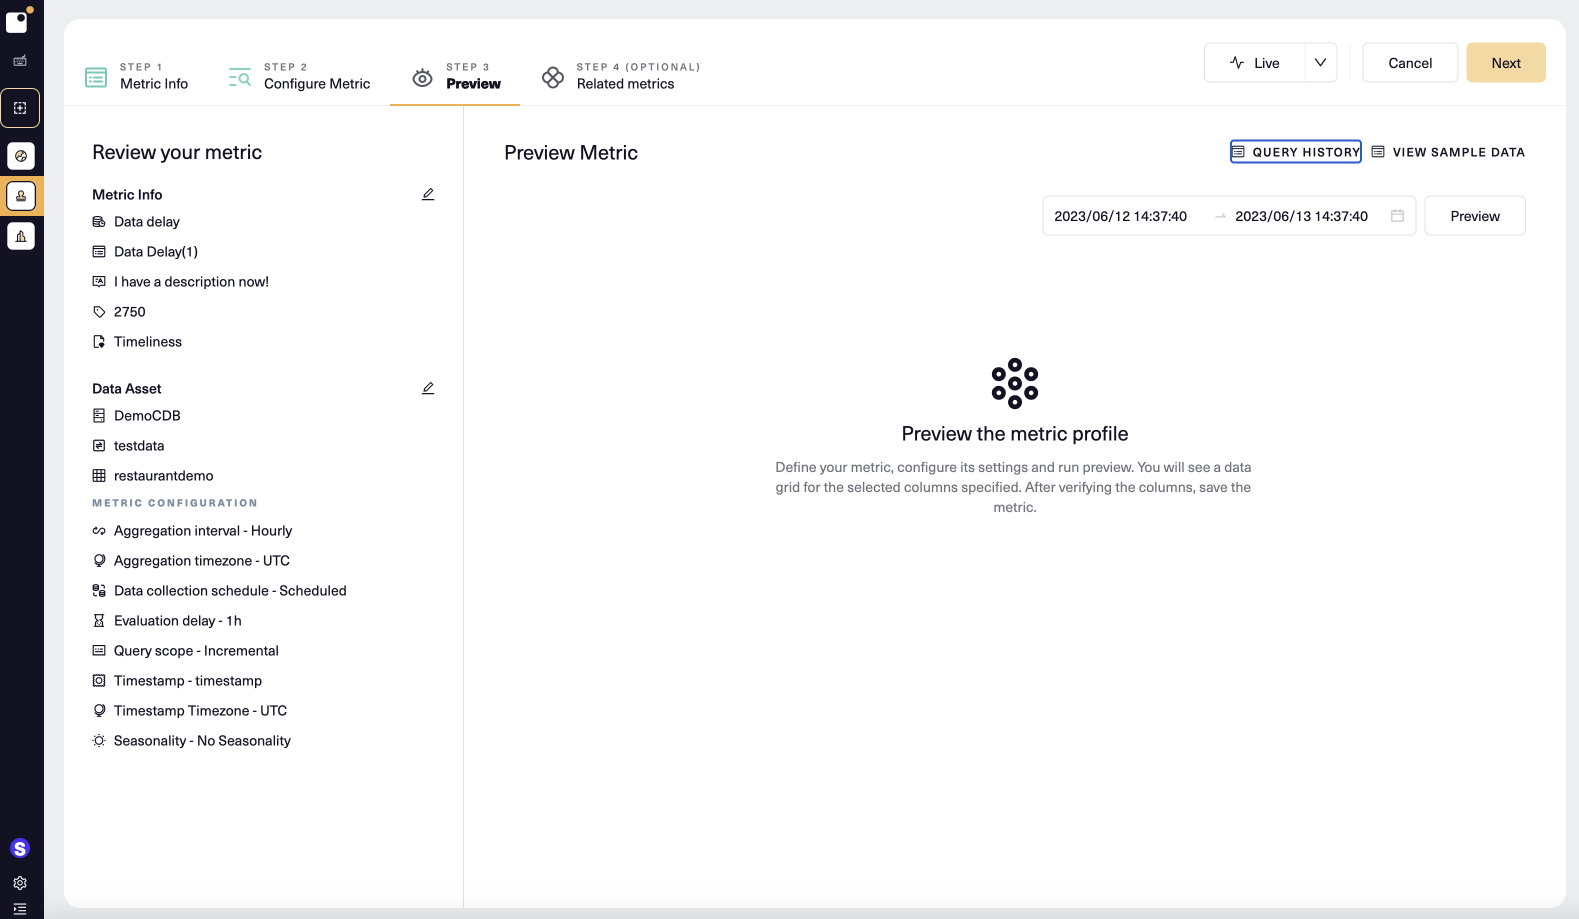
Open query history from metric preview
-
In a new or existing metric's configuration, on the Preview tab, select Query History.
-
By default, queries from the past 24 hours are listed. To change the date range to include up to a week of query history, just pick a start and end date and then select Update.
-
Select the name of the metric in any row to open the Query Details for that specific query instance.
Open query history in Explorer
- In the Explorer tree, select a metric. Its chart opens in the main page.
- In the chart, on the metric's menu select Query History.
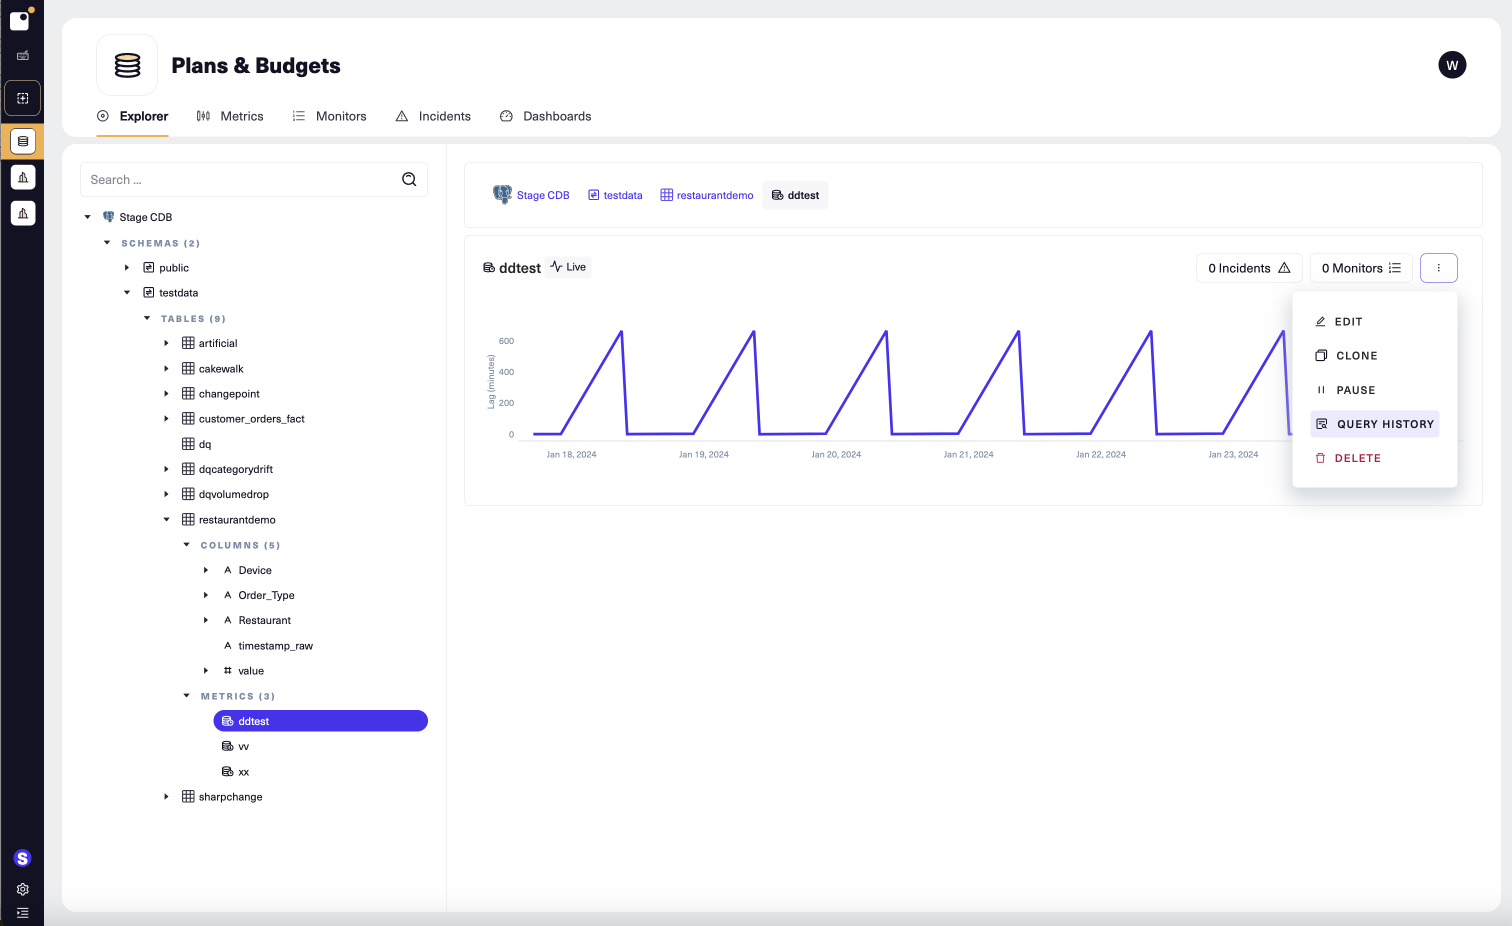
- Select Query Details in any row to open the Query details for that query instance.
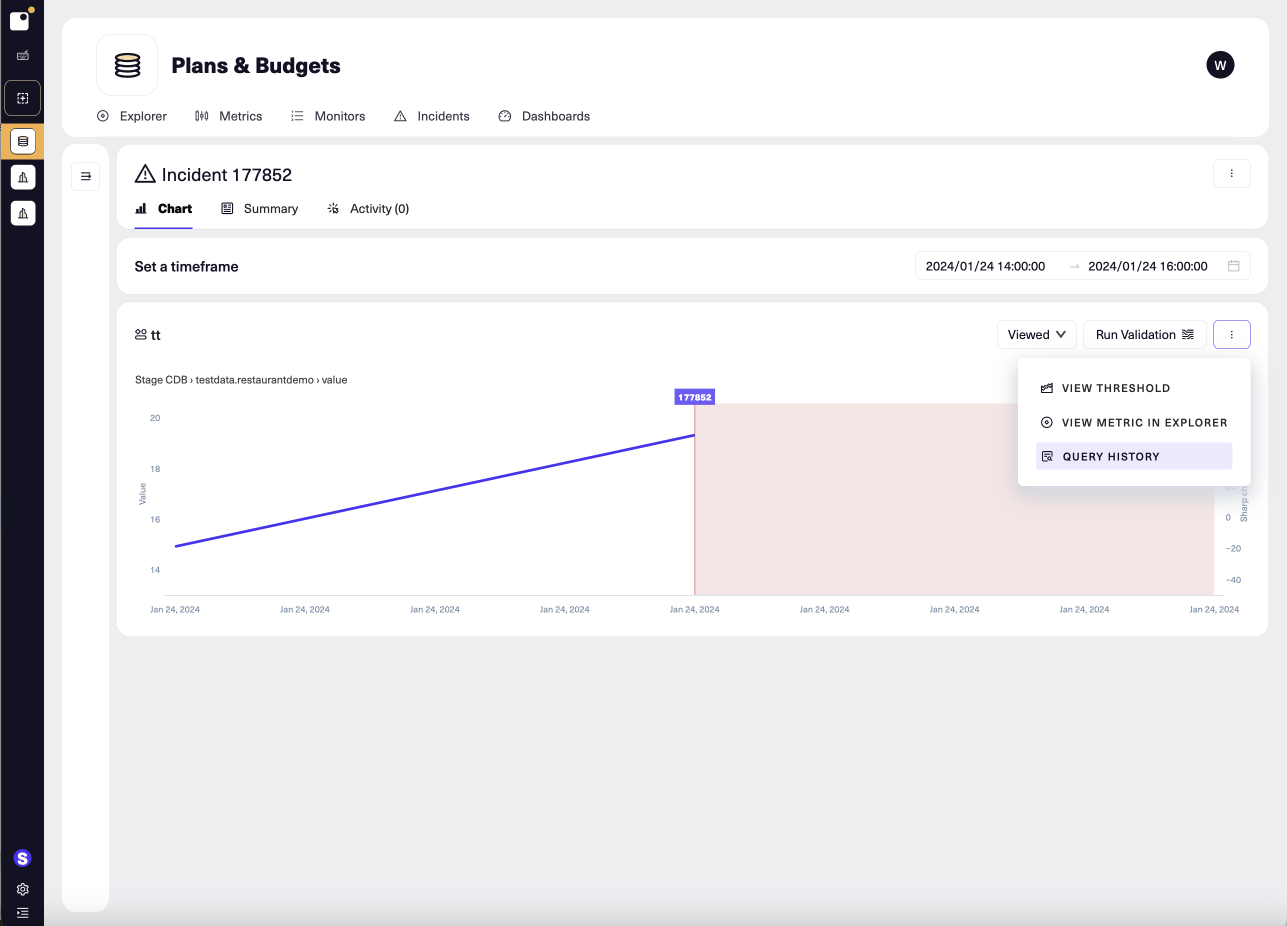
Open query history in an incident
- Open an incident's details.
- On the Chart tab, in the chart for the metric, select Query History from the metric's menu.
Updated 11 months ago