
Create a monitor manually
There are a number of configuration options that you can use to customize your monitor. You access these options from the Add Monitor flow and you can enter this flow two ways:
- On the Monitors List, select Add Monitor.
- From Explorer, when you click + Add you get a short form that lets you add a monitor with no configuration options. At the top of that form you'll see a blue link that says Manually configure monitor. This takes you into the Add Monitor flow with the metric name pre-filled, and you'll be able to perform all monitor configuration.
Once you enter the Add Monitor flow you will see the screen below. The top of the screen shows three tabs, Define, Train, and Preview.
Define
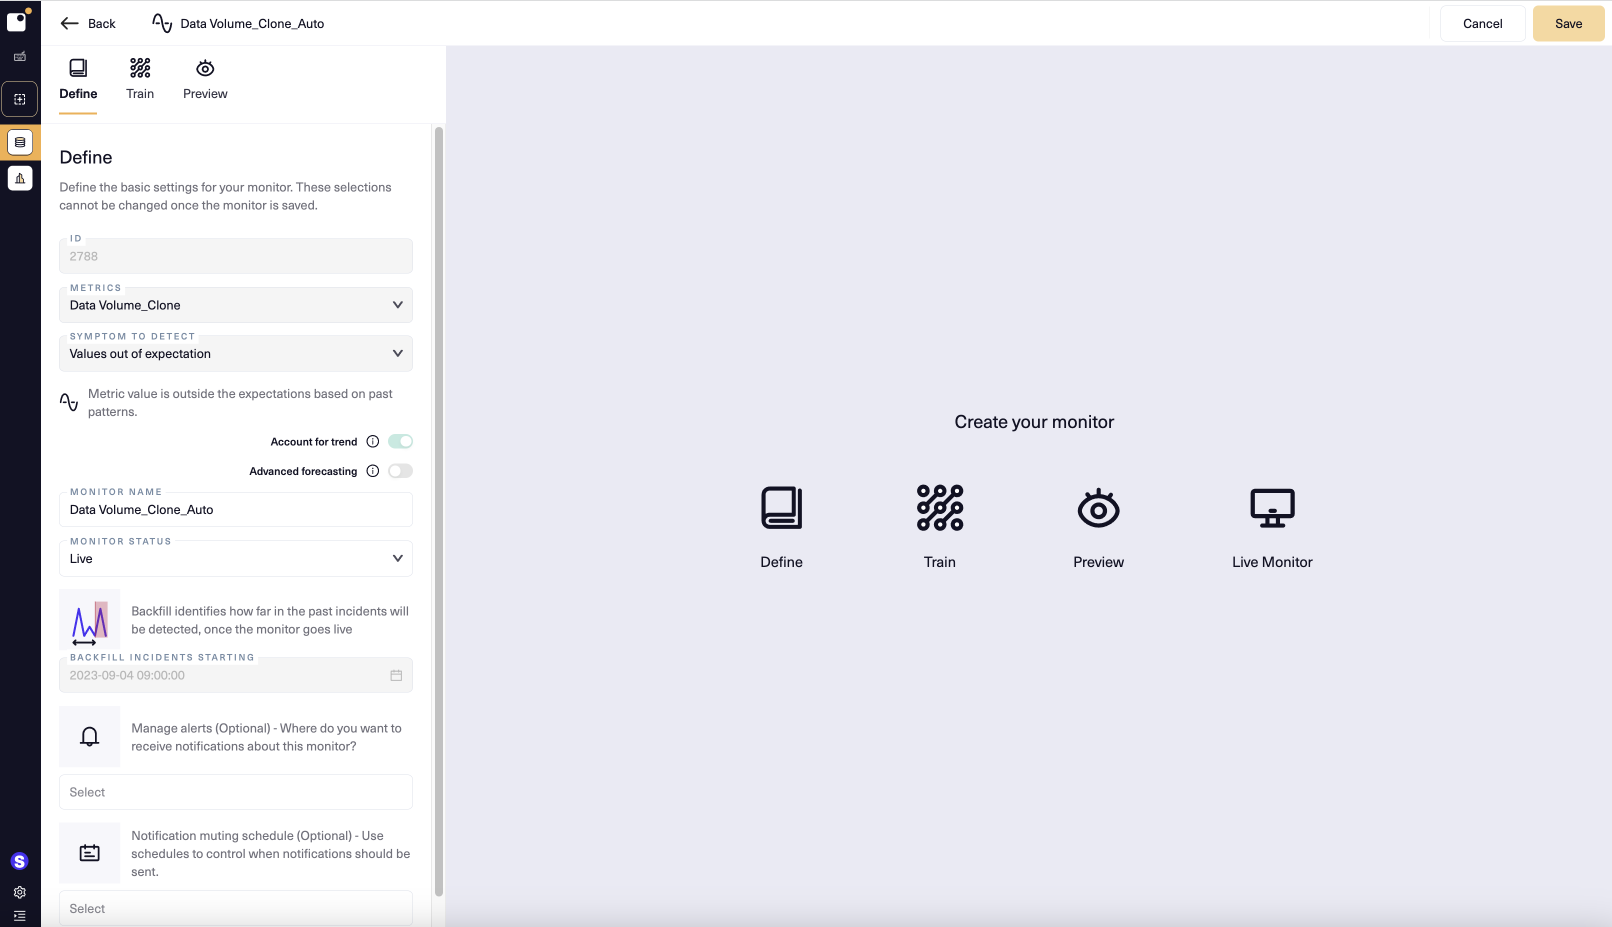
To create your monitor, in the Define pane:
- If it's not already specified, select the monitor's metric.
- Select the Symptom to detect. For definitions of the options, see the table of Define tab settings.
- If you're creating an anomaly monitor, you can enable Account for trend to allow the monitor to include trends in threshold calculations, or enable Advanced forecasting to have your monitor create metric forecasts. Note you can't enable both of these settings for the same monitor.
- Name the monitor.
- If you want the monitor to go live as soon as you save it, set Monitor Status to Live. Otherwise, the monitor will be Paused (you can then make the monitor Live when you view its metric in Explorer).
- By default, a monitor starts generating incidents as of the moment it goes live. If you want the monitor to identify incidents in historical data, set the Backfill Incidents Starting date to have the monitor look for incidents in metric data starting from that date.
- Optionally, choose an alerting channel and muting schedule. See Schedules for details on creating a schedule. Select Mute notifications to mute notifications just for the monitor.
- When you're done, select Next at the top right corner.
Monitor settings: Define tab
| Setting | Use case | Options |
|---|---|---|
| Metrics | Choose the metric/metric slice to monitor | Pick from a list of existing metrics/slices. |
| Symptom to Detect | Specify how monitors determine that metric values are out of bounds. |
|
| Account for trend | Include trends in anomaly calculations | Enable/disable. Mutually exclusive with Advanced forecasting. |
| Advanced forecasting | Forecasting of metric values | Enable/disable. Mutually exclusive with Account for trend. |
| Backfill Incidents Starting | Identify how far in the past incidents will be detected, once the monitor goes live | Select a date |
| Monitor status | Specify whether the monitor should be Live or Paused when saved | Select a status |
| Manage alerts | Identify a notification channel for incident alerts | Select a notification channel |
| Notifications muting schedule | Identify a schedule during which notifications will be muted | Select a schedule |
| Mute notifications | Turn off incident notifications for the monitor | Enable/disable |
Train
On the Train pane, provide values for any relevant settings. The available settings depend on which Symptom to detect you chose in the preceding step.
Manual threshold monitors
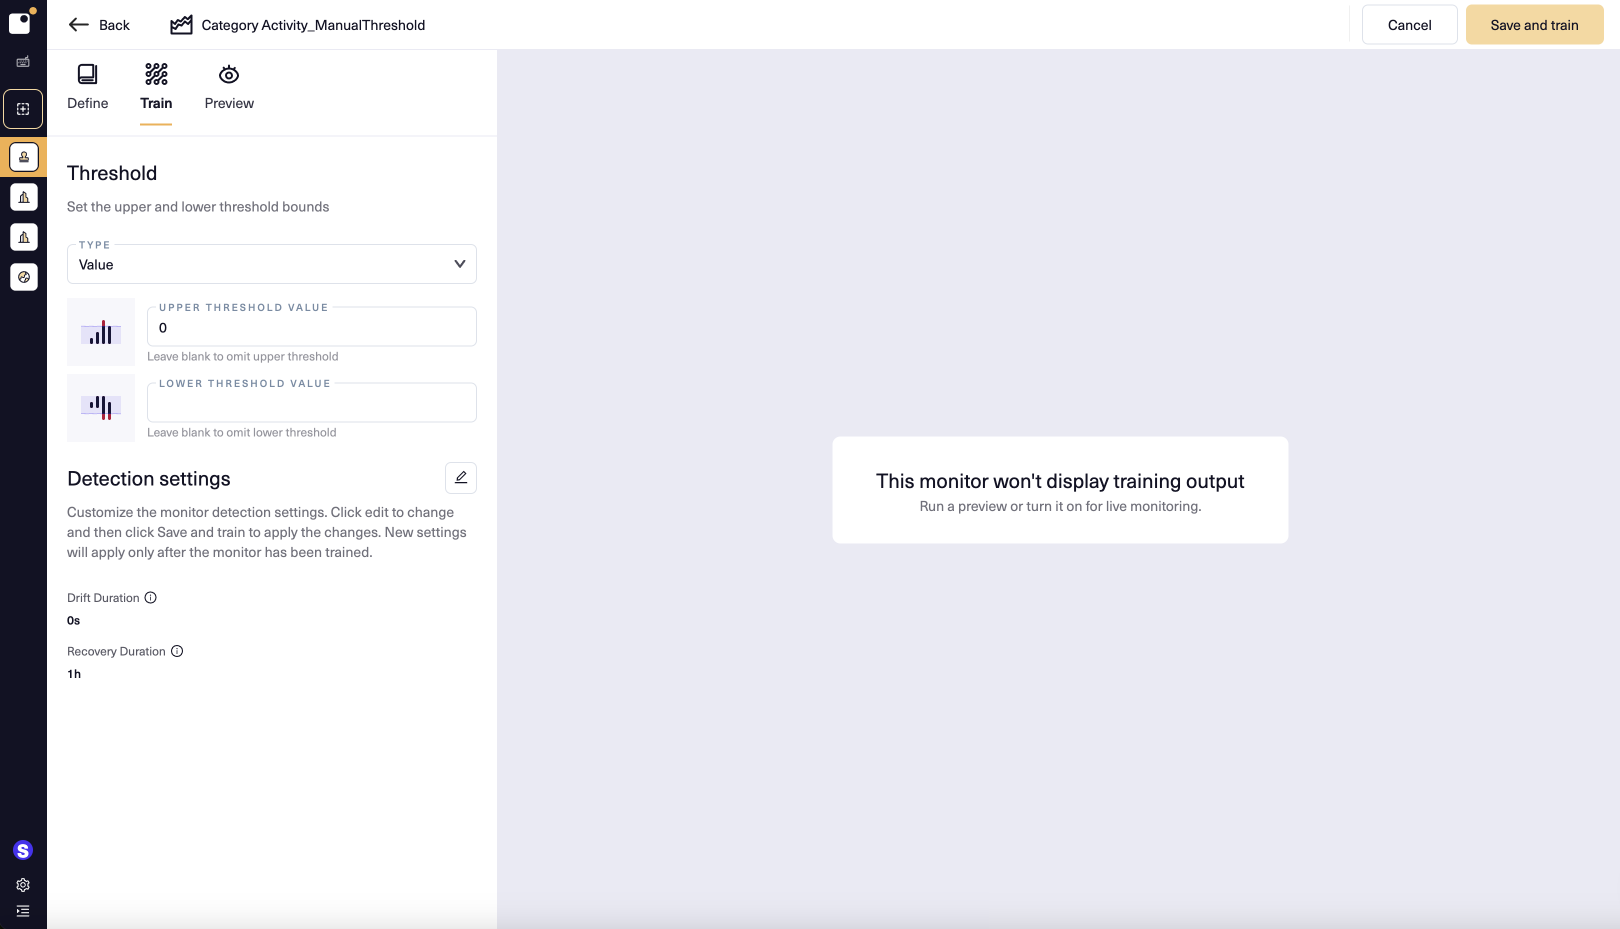
- If you chose Manual threshold, set your thresholds here. You can set one threshold, or both upper and lower thresholds, and can use Values, Percent Change, or Change as thresholds. If you choose Percent Change or Change, you'll also need to set the Period— the amount of time to compare against other periods when calculating the percent change.
- To adjust the detection settings, click the pencil to the right of Detection Settings and then select the settings you want in the modal that opens. For help deciding, see Monitor settings: Train tab.
- Click Save and train at the top right corner.
- After your monitor trains, click Back at the top left to return to the metric chart. If you set Monitor Status to Live on the Define tab, the monitor will begin logging new incidents. If the monitor is paused, you can select Resume on the metric chart Monitors menu to make it live.
Your monitor is now running. View the metric in Explorer and open the Monitors menu to see your new monitor in the dropdown. If it detects metric values outside of your thresholds, it generates an incident.
Anomaly detection monitors
- Add a training period by clicking + to the right of Training. A calendar opens where you can select a start date and an end date. An anomaly monitor needs at least two weeks of data to train. You can add multiple training periods. Training periods should only cover time ranges where your metric has known-good behavior. To identify these periods, review your metric's behavior in Explorer or in preview.
- To adjust the detection settings, click the pencil to the right of Detection Settings and then select the settings you want in the modal that opens. For help deciding, see Monitor settings: Train tab.
- Click Save and train to train your monitor.
- After your monitor trains, select Back at the top left to return to the metric chart. If Monitor Status is Live, the monitor will begin logging incidents. If you entered a Backfill Incidents Starting date, the monitor will check historical data for incidents as well as logging new incidents. All incidents, historical or otherwise, can be opened from the metric chart in Explorer.
After training has completed and your monitor is live, it starts monitoring. To see it in Explorer on the metric chart, select it from the Monitors menu: your new monitor appears in the dropdown. If Lightup's anomaly detection engine detects the metric is outside of bounds, an incident will be generated.
Monitor settings: Train tab
| Setting | Threshold type | Use case | Options |
|---|---|---|---|
| Drift Duration | Any | Set the drift duration: the amount of time that a detected anomaly must last before a monitor will log an incident. | Specify an amount and a time unit, e.g., 10 seconds. |
| Recovery Duration | Any | Set the recovery duration. Once a metric is within threshold, the recovery duration is the amount of time the metric must remain within threshold for the incident to end. Longer recovery durations can cause several short incidents to merge into one. | Specify an amount and a time unit, e.g., 10 seconds. |
| Aggressiveness | Anomaly detection | Set how sensitive the monitor should be. Low aggressiveness causes the monitor to pad the actual thresholds, and high aggressiveness causes the monitor to detect incidents when metric values are somewhat inside thresholds. | Select a value from 1 to 10. A value of 7 causes the monitor to strictly obey thresholds. |
| Drift Direction | Anomaly detection | Set whether to detect upward/downward drift. | Select an arrow to enable/disable detection in that direction. |
| Incident Learning | Anomaly detection | Set whether to use incident resolution to adjust anomaly detection. | Enable/disable (recommended setting is enabled) |
| Training periods | Anomaly detection | Include training periods with only known-good metric values. |
|
| Type | Manual thresholds | Set whether to use values or percentage change for thresholds. |
|
| Lower/Upper Threshold Value | Manual thresholds | Values/percentage changes of the thresholds, e.g., from 2 to 12 or from -2% to 10%. | Set at least one threshold. |
| Period | Manual thresholds | Only applies to Percent Change thresholds. Set the periods of time to compare to determine the percent change. |
|
Updated 11 months ago