
Aggregation metrics
Aggregation metrics let you apply an aggregate function to a data asset, giving you flexibility to measure a wide variety of data quality events and trends.
Create an aggregation metric
-
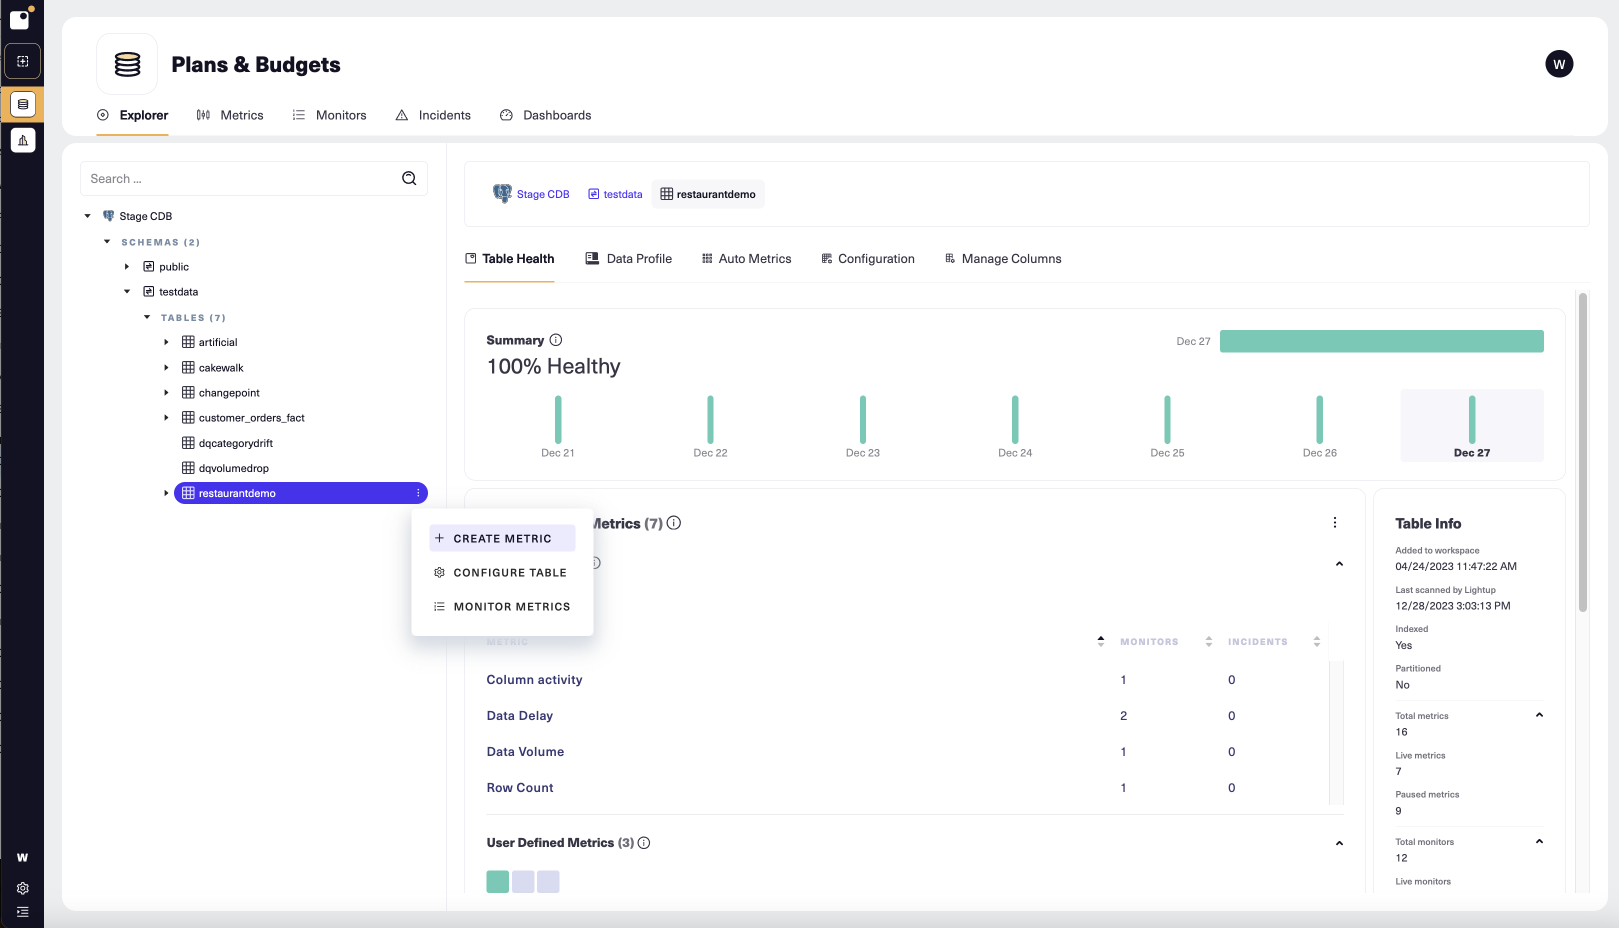
In the Explorer tree, select the data asset that you want to measure.
-
On the asset's Explorer menu select + Create Metric:
-
A new metric opens at Step 1 of the metric configuration form. Under Metric Info, select Aggregation.
-
Enter a Metric name.
-
By default, new metrics go Live shortly after you create them. If you want the metric to start off paused, under Metric status, set Status to Paused.
-
If desired, change the value of Quality dimension. Each data quality metric measures one dimension of data quality: accuracy, completeness, timeliness, or (if none of these applies), custom. You can sort and filter your metrics by dimension, and you can view them summarized by dimension in a data quality dashboard.
-
Select Next. Step 2 (Configure Metric) appears in the main form:
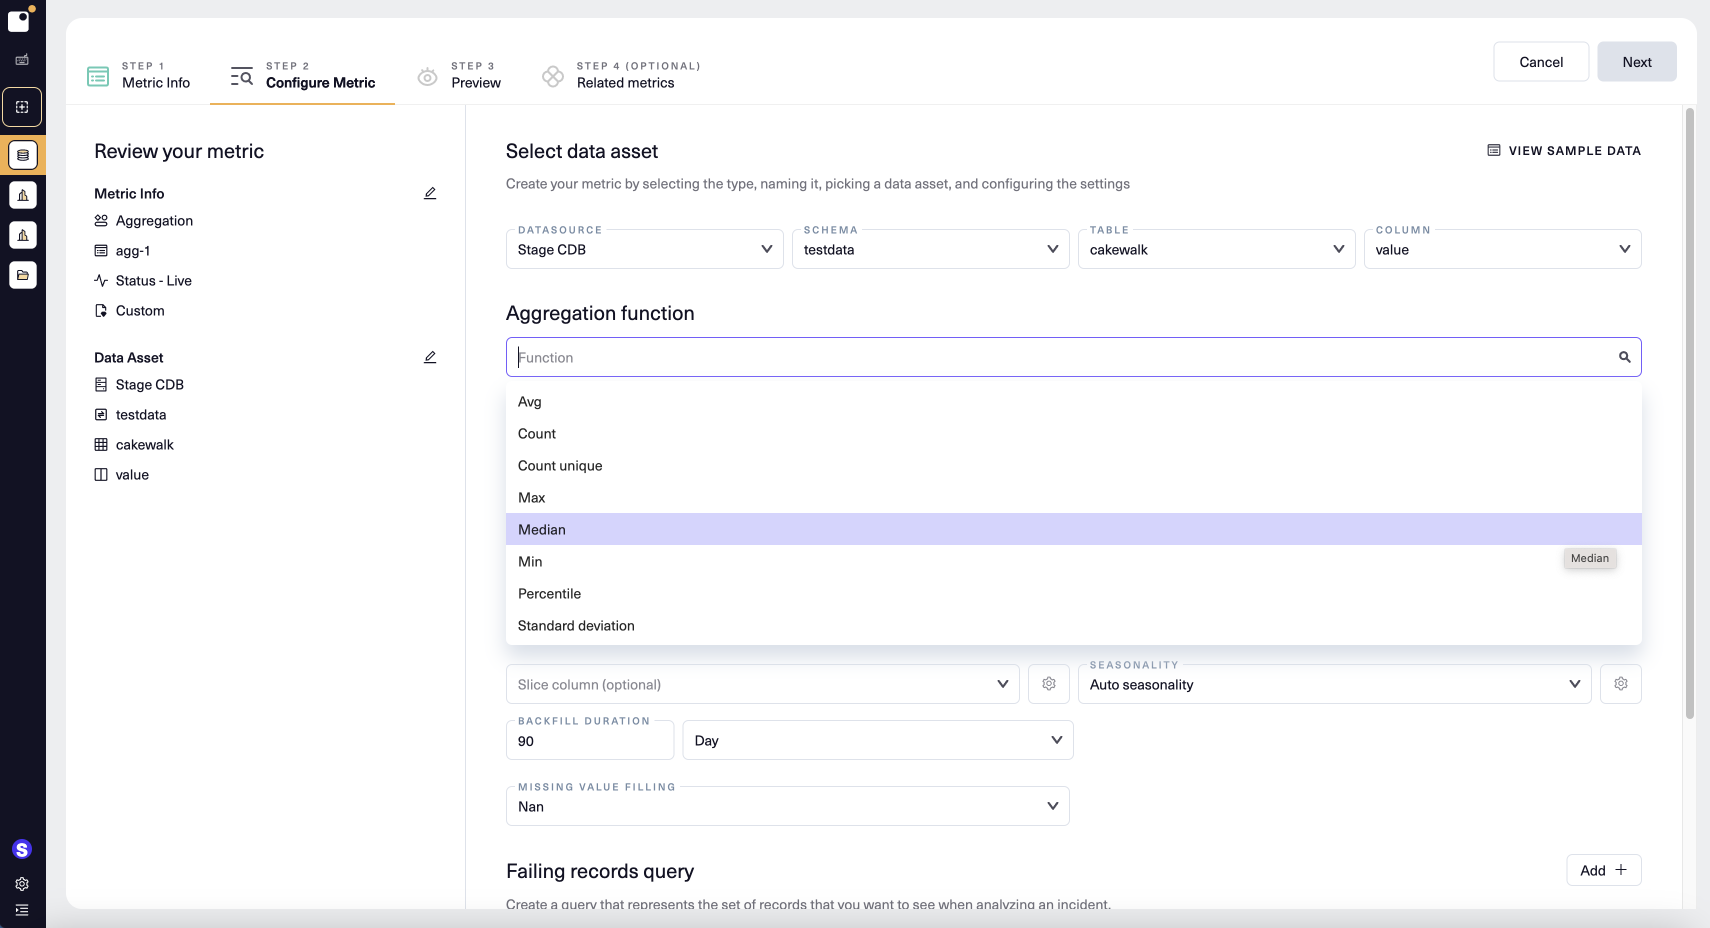
- Under Select data asset, make sure the right data asset is selected.
- Under Aggregation function, choose a function to apply to the column's values.
- Perform any optional configuration, as described below, then select Next to proceed to Step 3, where you can preview and save your metric.
Optional configuration
- Add a WHERE clause
- If needed, override the inherited table configuration
- Add slices
- Add seasonality
- Adjust the backfill duration
- Choose a missing value filling
- Add a failing records query
- Add tags
Preview
Once you have configured your metric you can preview it to view a live query without creating a datapoint. If the preview doesn't work the way you want, you can select the tab for a previous step and modify the configuration as needed.
- On the Step 3 (Preview) tab, set the date range for the preview, then select Preview.
- When you're happy with the result, select Next to continue.
You don't have to preview your metric— you can just click Next to proceed to Step 4 (Related metrics).
Add Related metrics
You add related metrics at Step 4 of metric configuration. Related metrics always appear in the list of metrics available during incident analysis.
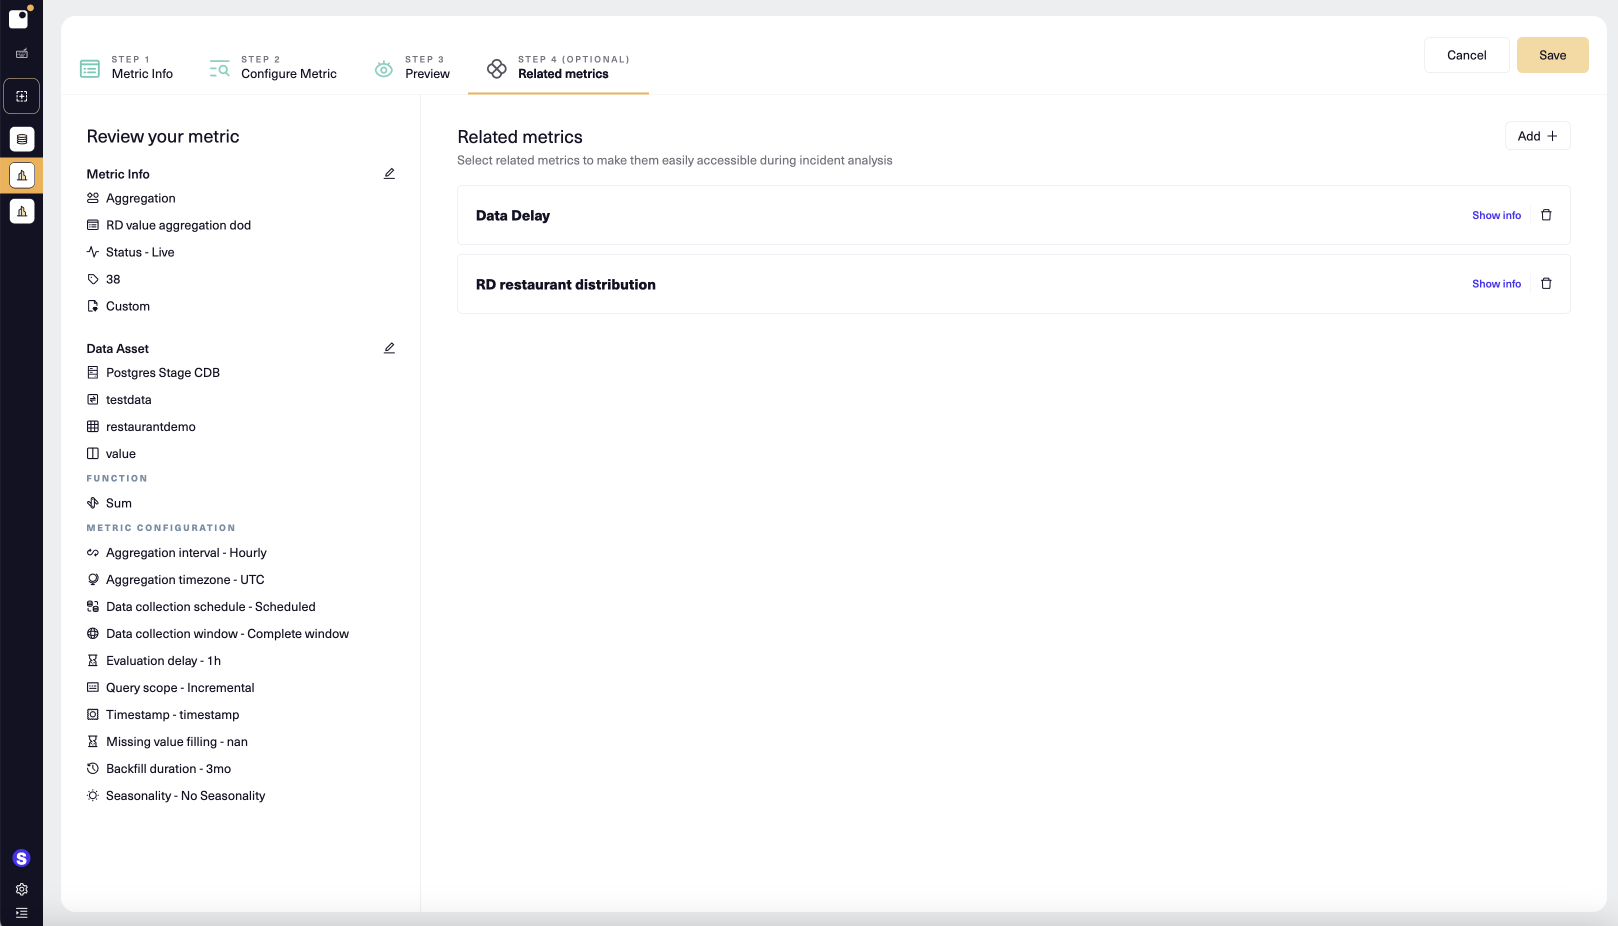
- To add a related metric, select Add + and then choose a metric in the listbox that appears.
- Select Show info inside a related metric to display the metric's ID and data asset(s).
- When you've added the related metrics you want, select Create (for a new metric) or Save.
- During incident analysis of the metric, any related metrics appear in the metrics listed on the left. You can then easily add them to the Metrics of interest, making the metric chart available within the incident.
Updated 11 months ago