
Slices
Slicing enables you to monitor your data across groupings, or slices, that represent the organization of your business. For example, suppose you have a table with sales data and you have region column that represents the four sales regions: north, south, east, and west. You can create an unsliced metric that measures all sales, or you can create a sliced metric that slices sales by region. In this example, your slice column is region and the slices are north, south, east, and west.
Your slices can be based on multiple columns. For example, suppose that the sales recorded in the table are all done via app. In addition to the sales region, you could slice by the device type: iOS or Android. Each slice would be the combination of region and device, e.g. region:north, device:iOS.
Each slice is treated as an individual metric— monitors train slices separately and detect incidents for each of them. Lightup automatically and dynamically detects slices as they appear, but you'll need to train any monitors to include the new slices.
Add slices
You add slices on the Configure Metric tab of a metric.
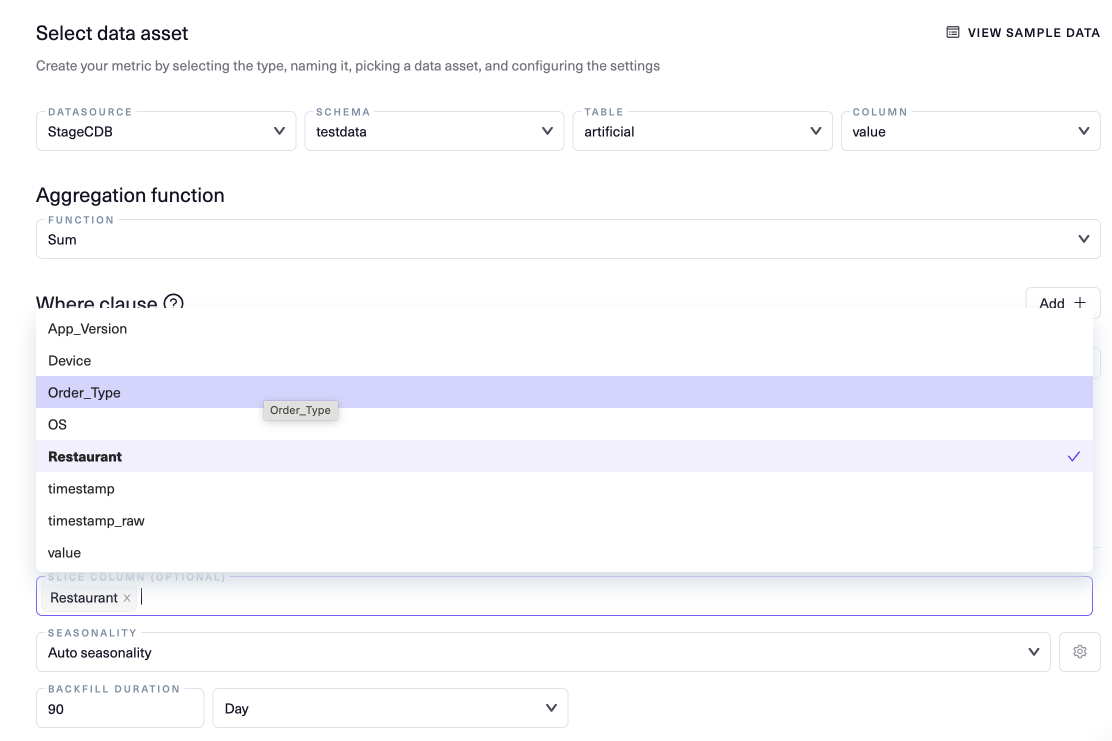
- Select the Slice column (optional) field to display the columns available for slices.
- In the list that appears, select the columns to use for slices.
- Your slice columns should be categorical columns - it doesn't make sense to slice by non-categorical columns.
- The order you select the columns determines the order of slices. Each value of the first column is combined with the first value of the other columns to produce the first slices, then combined with the second value of the next column etc., until slices exist for all possible combinations of the column values.
For example, if you chose Restaurant and Order_Type, each slice would list the value of Restaurant first followed by the value of Order_Type. The first slice would have the first value of Restaurant and the first value of Order_Type, the second slice would have the second value of Restaurant and the first value of Order_Type, and so on for all values of Restaurant. Then each value of Restaurant would be combined with the second value of Order_Type, and so on until each value of Restaurant is combined with each value of Order_Type to produce a unique slice. - To remove a column, select the x at its right edge.
- When you finish selecting columns, click outside the list.
Slices in compare metrics
- If you want to use slicing in a row by row metric, you'll fill out two Slice column (optional) fields, one for the source and one for the target. Make sure the slices have the same columns in the same order.
- You can't add slices to a compare aggregates metric, but you can compare sliced metrics. When you add metrics to compare, make sure they have the same slice columns. If you compare metrics that have different slice columns, the wrong slices may be compared to each other.
Updated 11 months ago