
Review DQ in Alation
Alation is a Data Intelligence Platform that includes Data Catalog and Data Quality components to help you find the data you need and evaluate its fitness for your intended purposes. Lightup's Alation integration helps you understand your Alation data health at a glance, with links to perform deeper analysis on Lightup. If your workspace has an Alation integration set up, you can review DQ Health information about tables in supported datasources. For an introduction, see Alation's Help page, View Data Health.
In Alation, each Table page has tabs, several of which display data quality health information. In addition, the Table Trust Flag reflects the current health with a colored icon (red, yellow, green).
Table Health tab
The Health tab shows the current data quality state of the Table and the related Columns. Lightup monitor information for these assets is visible in the Health tab's Data Quality section. Incidents generated by these monitors are highlighted in Alation with an appropriate color coded status, and a count of these incidents appears on the Health tab handle.
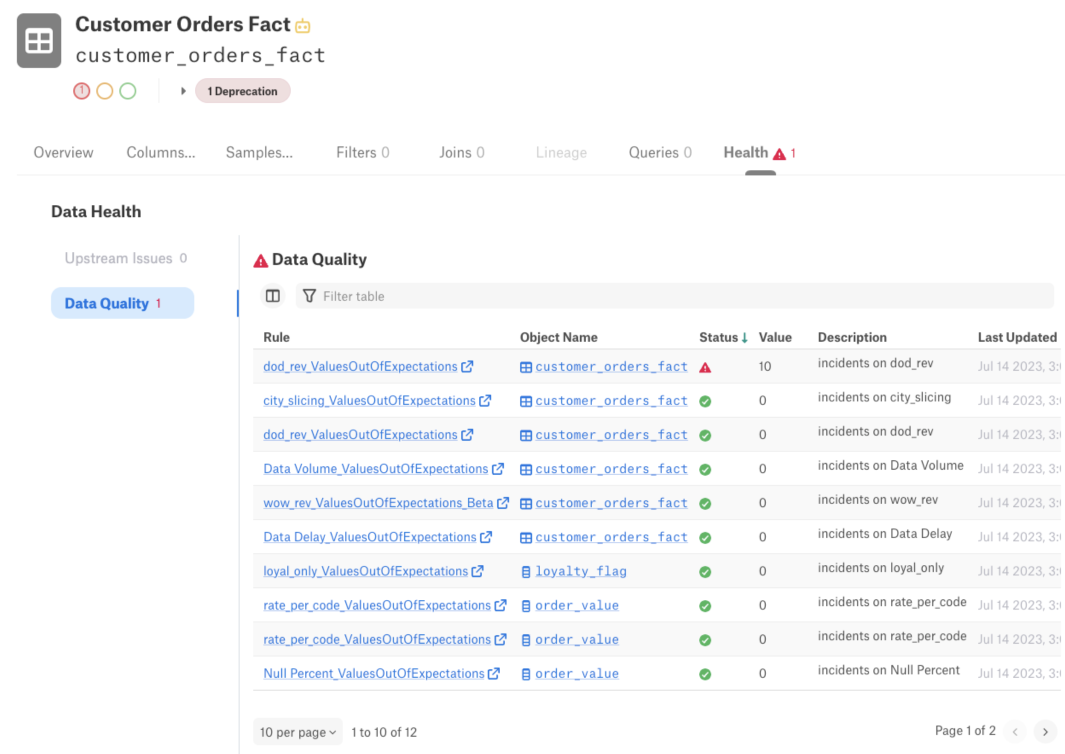
Table Overview tab
Data health information appears on the Table Overview tab in the Sample Columns section:
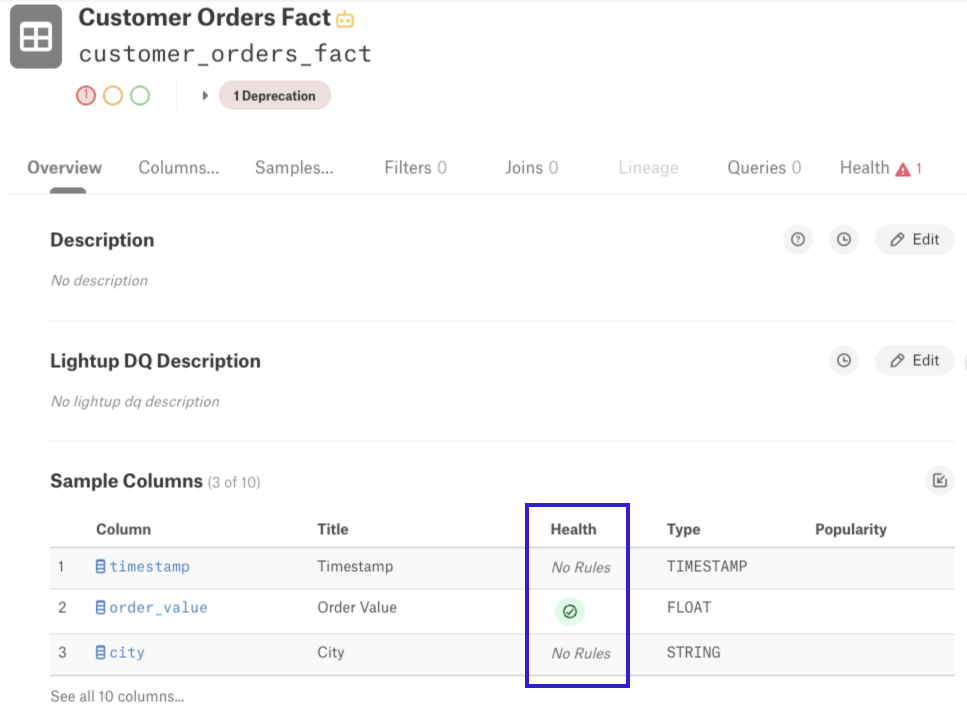
Table Columns tab
Data health appears on the Columns tab in the Health column:
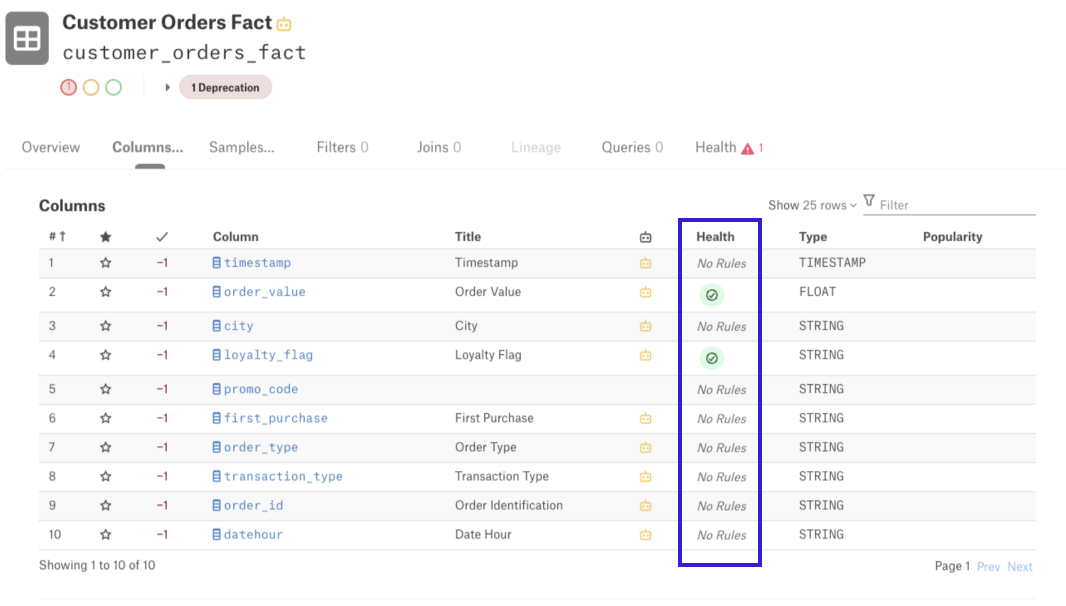
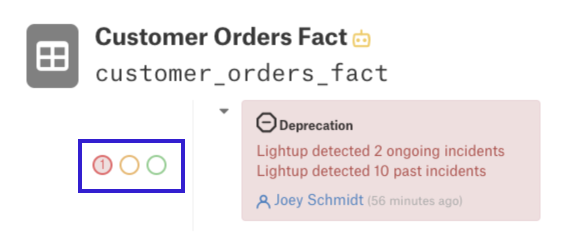
Table Trust Flag
The Table Trust Flag is a summary indicator of data health located just below the title, on the left:
View Table Health
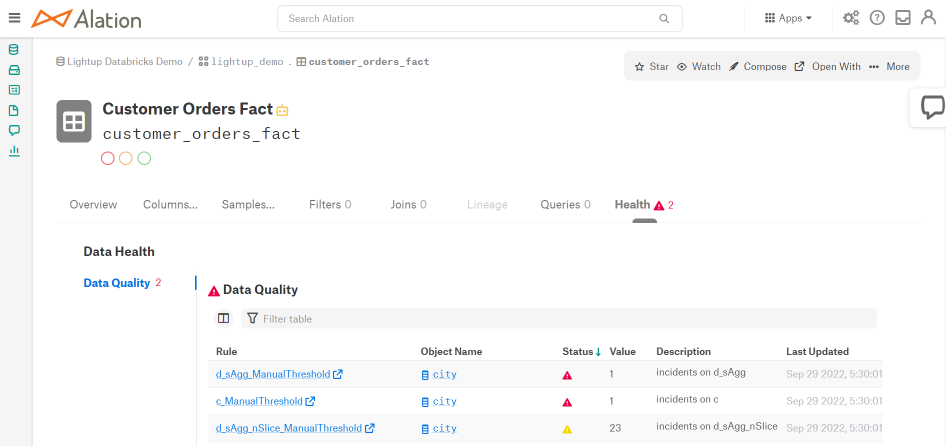
When you open a Lightup-integrated table in your Alation data catalog, corresponding incidents are listed in tabular format on the Health tab's Data Quality section.
- The Rule column has a link back to the relevant incident in Lightup, so you can perform deeper analysis there.
- Incident progress is indicated in the Status column— a red warning icon for ongoing incidents, and a yellow icon for completed incidents.
- Note that the Health tab label displays a count of ongoing incidents in red.
For steps and more information, see Alation's View Table Health.
Interpret Alation Health information and take action
Monitors and incidents appear in Alation as messages: red deprecations, yellow warnings, and green endorsements.
These messages are based on the state (progress and status) of incidents generated in Lightup. When the incident progress or incident status changes in Lightup, that change is reflected by the related Alation message. The table below shows the mapping of Lightup incident state to Alation messages.
| Incident progress | Incident status | Alation Message |
|---|---|---|
| Ongoing | Submitted | Deprecation |
| Viewed | Deprecation | |
| Unviewed | Deprecation | |
| Completed and still within incident window | Closed | Warning |
| Rejected | Warning | |
| Submitted | Warning | |
| Viewed | Warning | |
| Unviewed | Warning |
These messages appear in three places in Alation.
- Incident progress and status are reflected by the message (warning or deprecation) for a table in your data catalog.
- Deprecations also appear in the lineage of assets in your catalog, so you can review them inline with other lineage information.
- Deprecations and warnings appear as popups when you run a query against the related asset while using Compose.
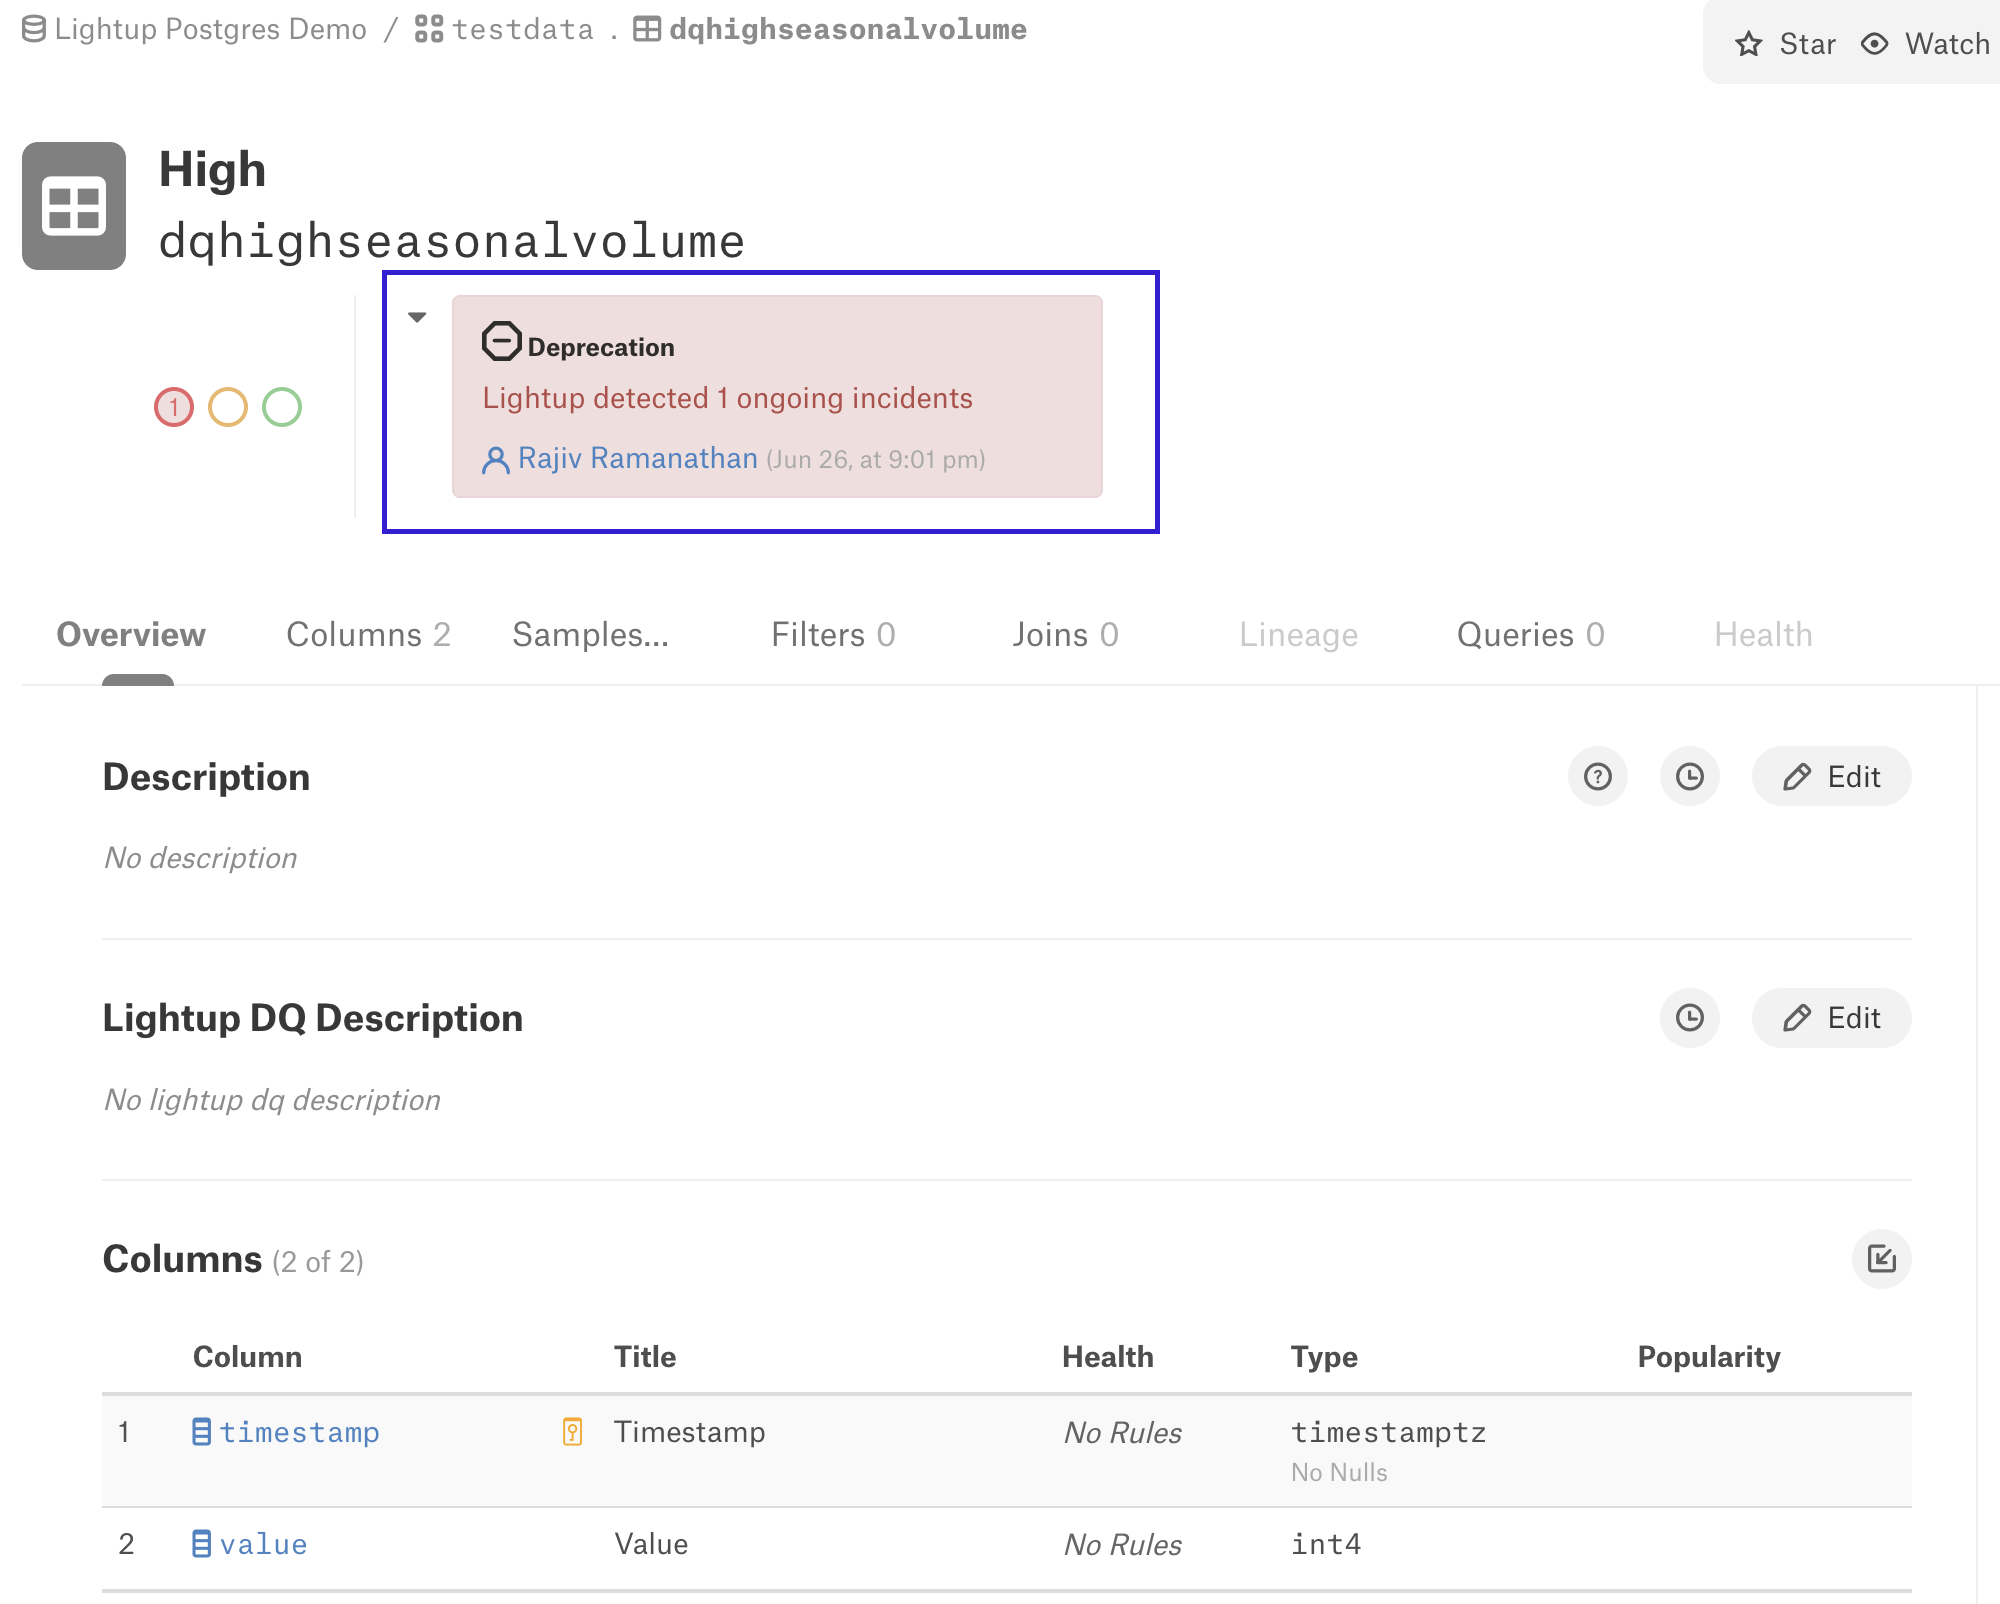
View messages in the data catalog
When you view a table in your Alation data catalog, if there are any Lightup incidents from the most recent incident window a message appears just below the title, next to the Trust Flag. The message color reflects the severity: a red deprecation for ongoing incidents, or a yellow warning for completed incidents.
Viewing incidents in a Lineage Diagram
When you select the Lineage tab in Alation, you can view related incidents for the asset.
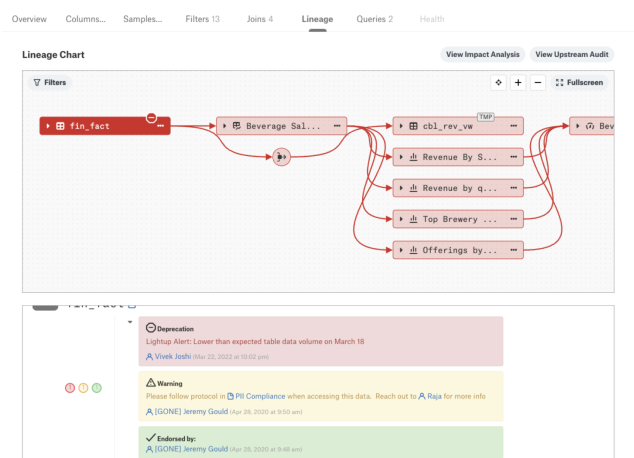
For help, see Alation's Reading the Lineage Diagram.
Data health popups in Compose
When you run a query in Alation Compose, if there are ongoing incidents for a referenced asset a red deprecation titled Don't Use This Table appears and displays the associated message.
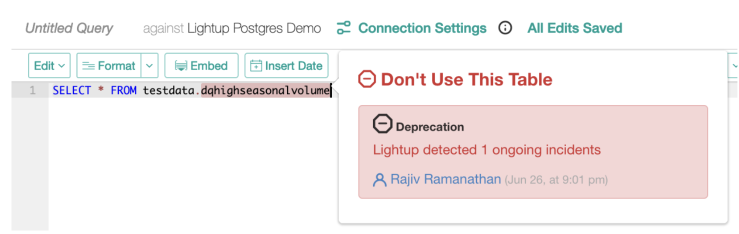
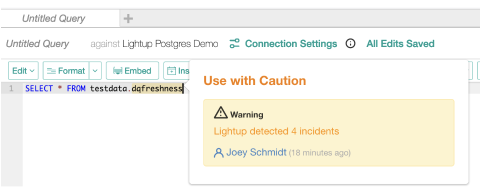
If there are incidents in the past, a yellow warning titled Use with Caution appears and displays the associated message.
Updated 11 months ago