
Create and edit metrics
Once you've added some data assets, you can create metrics to measure their data quality. All the metrics described here are deep metrics— metrics that you create to answer more specific data quality questions by querying your data. Typically, you create deep metrics after establishing which assets to focus on, through data profiling and auto metrics.
Create a metric
To create a metric, we recommend you start in Explorer. When you create a metric in Explorer, the data asset info is filled in for you, streamlining metric configuration.
Metric configuration is different for each type of metric. For steps, see below for a link to the page about the metric type you want to create:
Column metrics
- Aggregation metrics measure changes in the result of an aggregate function that you select.
- Conformity metrics measure the validity of data by checking whether values meet one or more conditions that you specify.
- Distribution metrics measure the distribution of values in a specified column.
- Null percent metrics measure the percent of a column's values that are null.
Comparison metrics
- Compare aggregate metrics let you compare one or more pairs of existing metrics for a source table and a target table.
- Row by row metrics let you measure data value differences between a source table and a target table, by picking key fields (to match the rows) and which columns' values you want to compare.
Table metrics
- Data delay metrics measure delay in the arrival of expected data into data assets. Available for use with tables and schemas.
- Data volume metrics measure deviations from expected data volumes. Available for use with tables and schemas.
SQL metrics
SQL metrics measure whatever you model with valid SQL, but must include a SELECT statement that meets basic metric query requirements.
Edit a metric
- In the Explorer tree, select the data asset that the metric is based on.
- On the right, find the chart for the metric you want to edit. Then, in its top-right corner select the three vertical dots, and then select Edit.
The Metrics list
The Metrics list is an easy way to work with all the metrics in a workspace. To open it, select Metrics in the top bar.
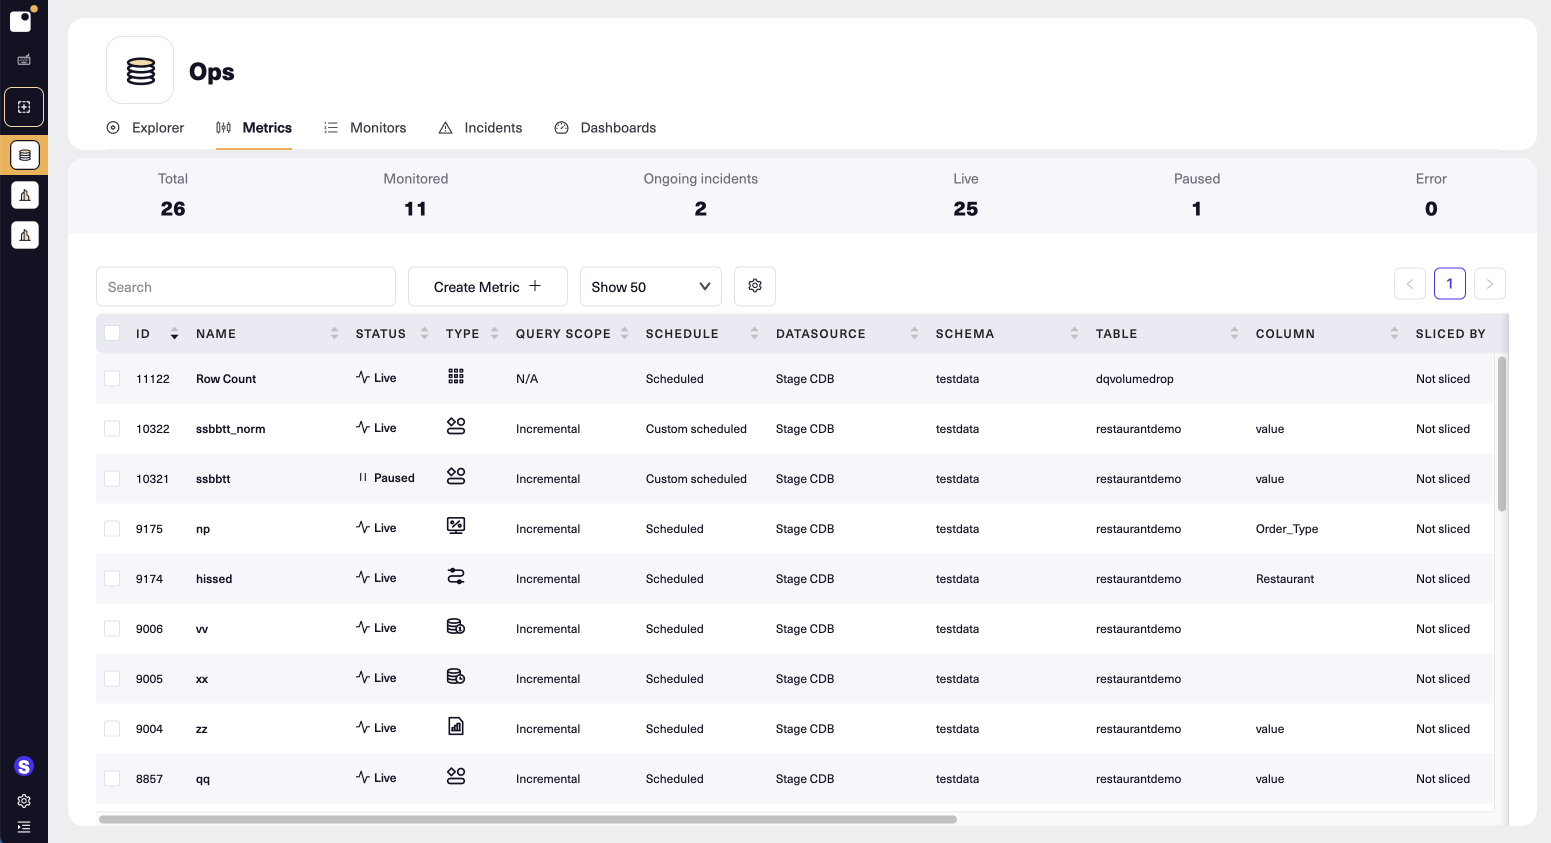
Assess metrics at a glance
Tiles across the top of the list display counts of metrics in the workspace:
- Total (all metrics)
- Monitored (metrics with at least one monitor attached)
- Ongoing incidents (metrics currently generating an incident)
- Live (metrics currently active)
- Paused (metrics currently paused for any reason)
- Error (metrics stopped by an exception, or after three query timeouts due to query governance settings)
Using list controls
Just above the list items, controls let you work with the list:
- Search for a metric across columns by name or by attribute. Click the Search box and type or scroll to find a search term, then select a term to filter the list to matching items. You can add multiple search terms to narrow down the displayed items more.
- Create a new metric with Create Metric +.
- Select the number of rows to display per page by selecting Show<n>.
- Choose which columns to display by clicking on the gear icon. For example, you might want to display Last Modified By so you can filter and sort based who made the most recent change to the metric.
- Navigation arrows and page numbers let you jump around in the list.
- The left column lets you select items to perform bulk operations on them. Note that if you select specific items and then add search terms that exclude any of them, non-matching items won't be displayed but will still be selected— if you remove the relevant search terms the items will appear again.
Working with list items
In the list header, you have more options for working with list items:
- Select the check box to select all items currently displayed on the page. If other pages exist, a banner appears just above the listed items with a link to select the rest of the items. For example, you might have 50 metrics listed per page, 200 live metrics, and 300 metrics total. To select all live metrics, you could search for Status=Live, select the check box to select the first page of 50, and then click the banner link to select the remaining live metrics.
- Select a column heading to sort the list using the column's values in ascending order. Select it again to reverse the sort order. Select it a third time to stop sorting using that column.
- Click a value in the Name column to open a context menu that lets you do a variety of operations on that metric.
- Select a value in the Status column to set the selected metric's status, e.g., to change it from Live to Paused.
Updated 10 months ago