
Profile your data
To better understand your data and help enhance your data quality analysis, enable data profiling. Data profiling provides a static analysis of your tables that you can view in the Explorer tree. Data profiles are currently generated only for string, numeric, and time-oriented columns. Other data types such as boolean will be absent from the results.
You enable data profiling when you add data assets to Explorer. The initial data profile uses up to one million rows to create each table's data profile, as follows:
- For a table with under a million rows, the data profile covers the entire table.
- If Lightup can determine which timestamp column to use for time-range queries and the table has at least a million rows, the data profile covers the latest 30 days worth of data.
- If Lightup can't tell which timestamp column to use for time-range queries and the table has at least a million rows, the data profile covers one million randomly-selected rows.
If you aren't sure what types of data quality checks you want, we recommend you enable data profiling to learn about your data. Reviewing these data profiles will give you the info you need to proceed with your data quality journey.
Enable data profiling
You enable data profiling in Explorer. You can enable the data profile for just one table, or you can enable all data profiles for the tables within a datasource or schema.
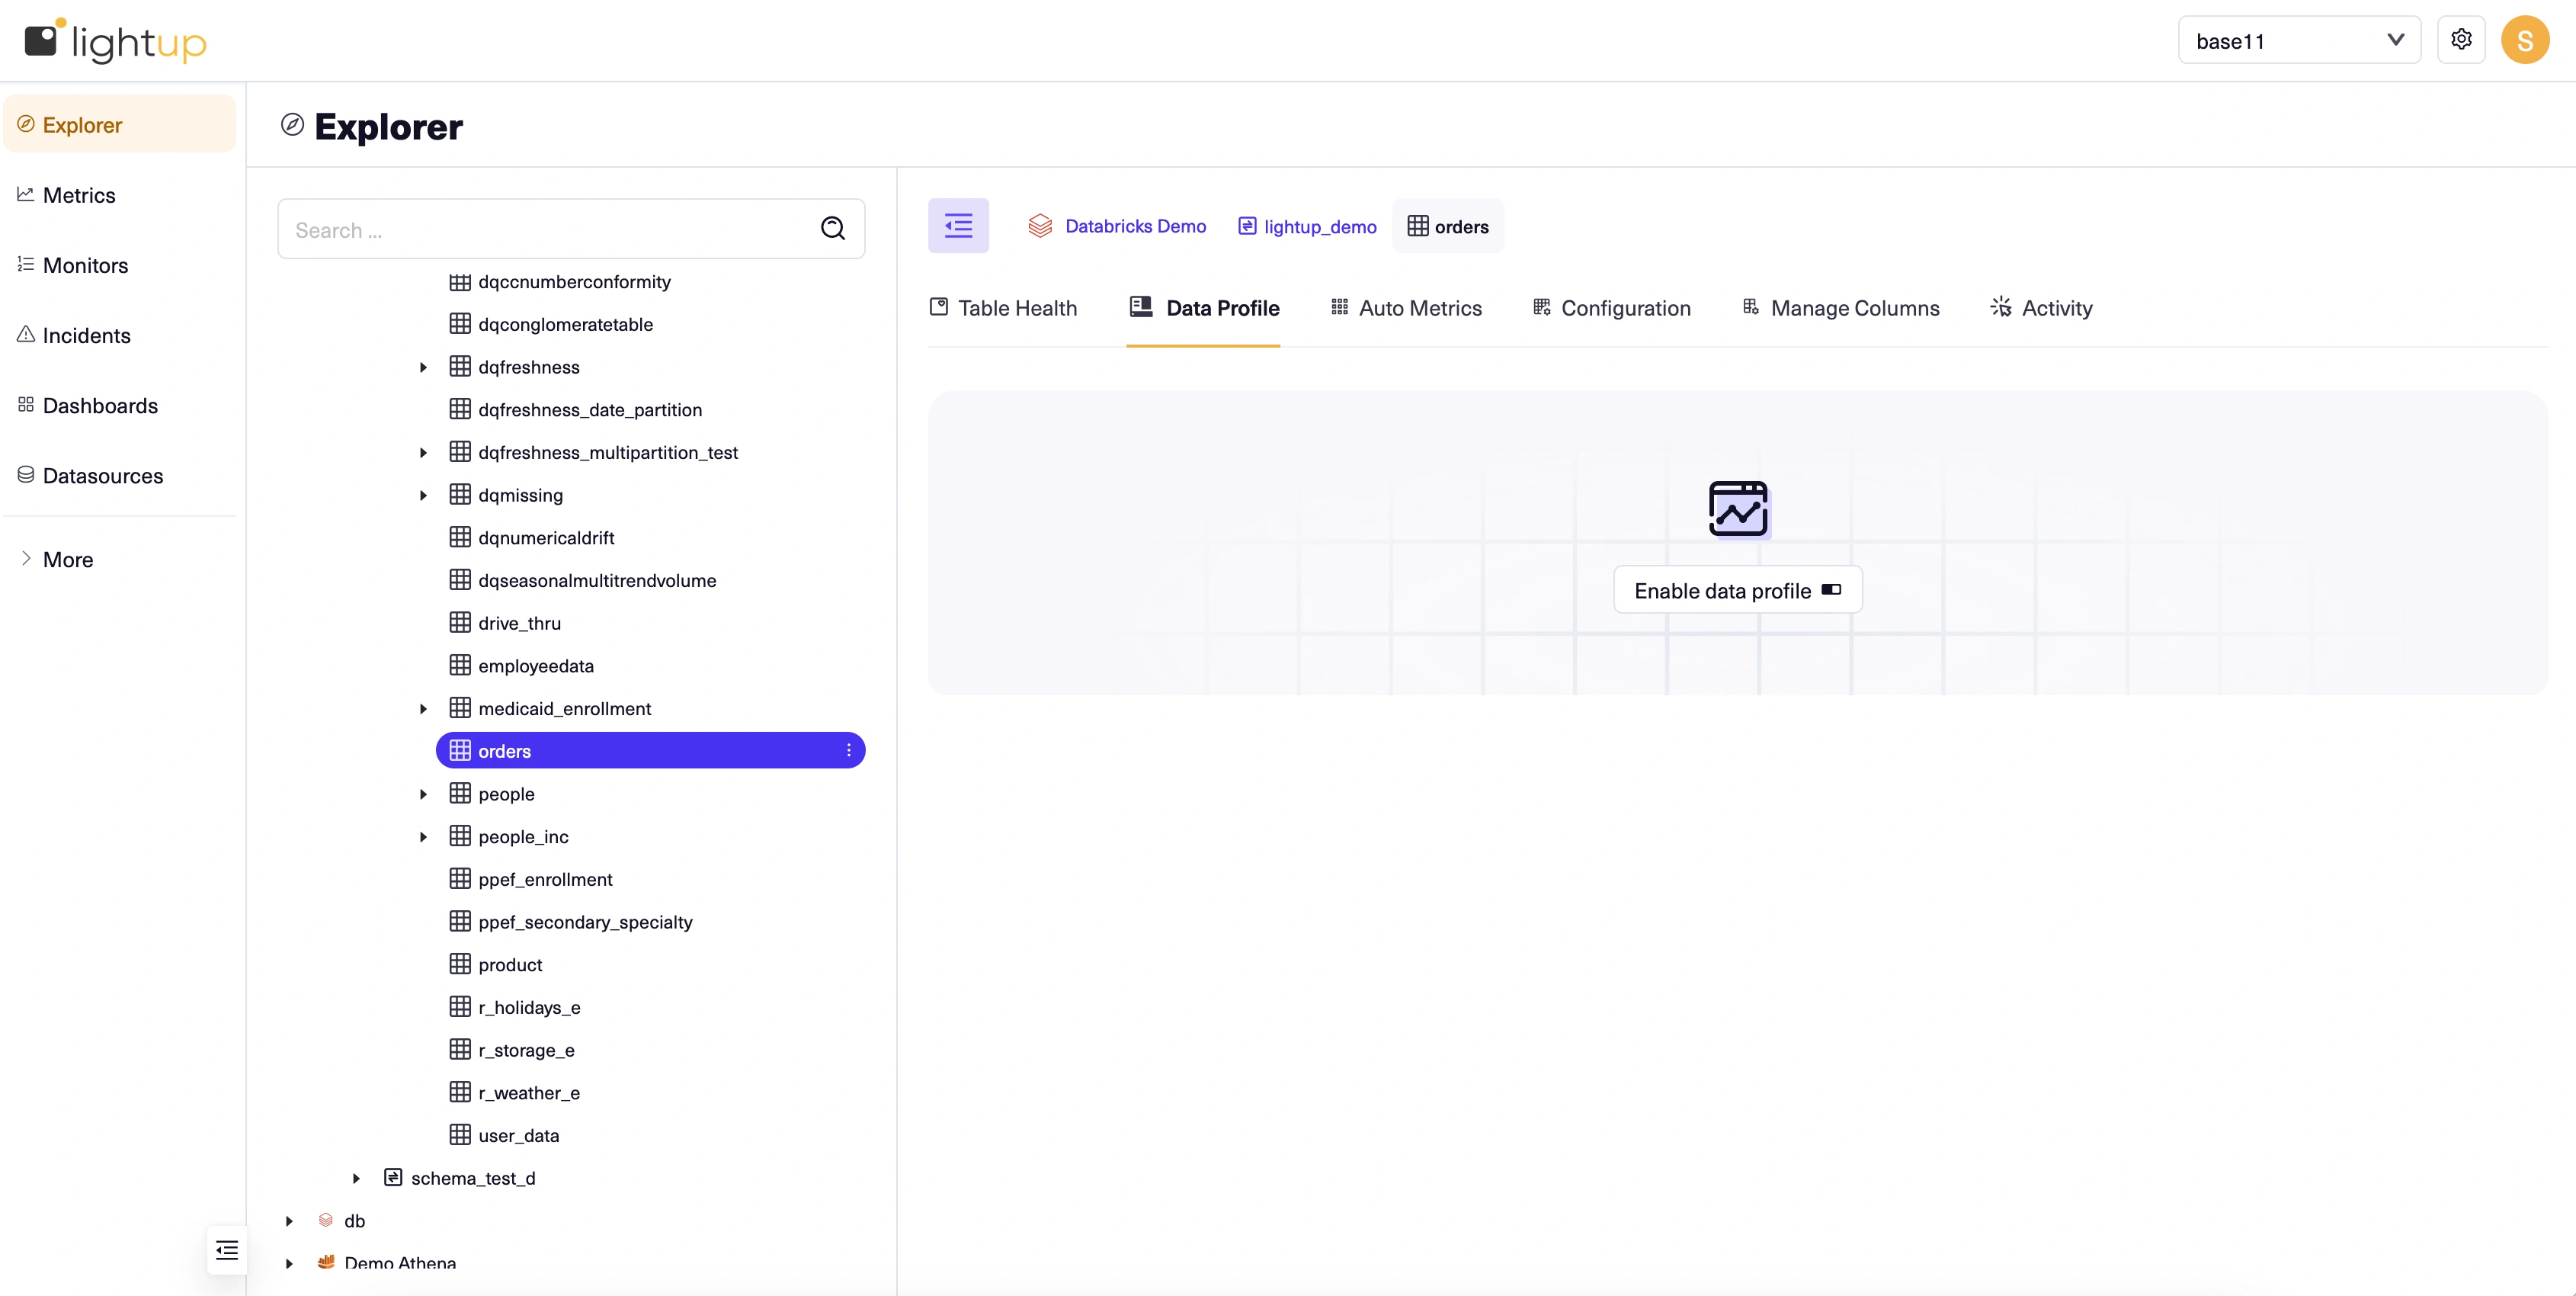
Enable one table's data profile
- Select a table in the Explorer tree.
- On the Data Profile tab, select Enable data profile.
Enable data profiling for all tables in a datasource or schema
When you add a datasource or a schema to the Explorer tree, you can then enable data profiling for all the tables within that datasource or schema. Note that enabling all data profiles for a datasource only affects tables inside of its active schemas.
- Select the datasource or schema in the Explorer tree.
- On the Summary tab, under Enable all data profiles, select Enable all.
Pattern detection during column profiling
Lightup uses pattern detection to determine the contents of table columns. In addition to timestamps, Lightup detects UUIDs, phone numbers, e-mail addresses, US ZIP codes, SSNs, and URLs. You can hover over the label Patterns Detected on a column profile for a quick reminder.
Review data profiles
After data profiles are generated, you can review them to help you plan your data quality analysis. For example, reviewing a table's profile will clarify which columns can be used for timestamps in metrics.
When you select a table in the Explorer tree, its Data Profile tab displays the table's current data profile:
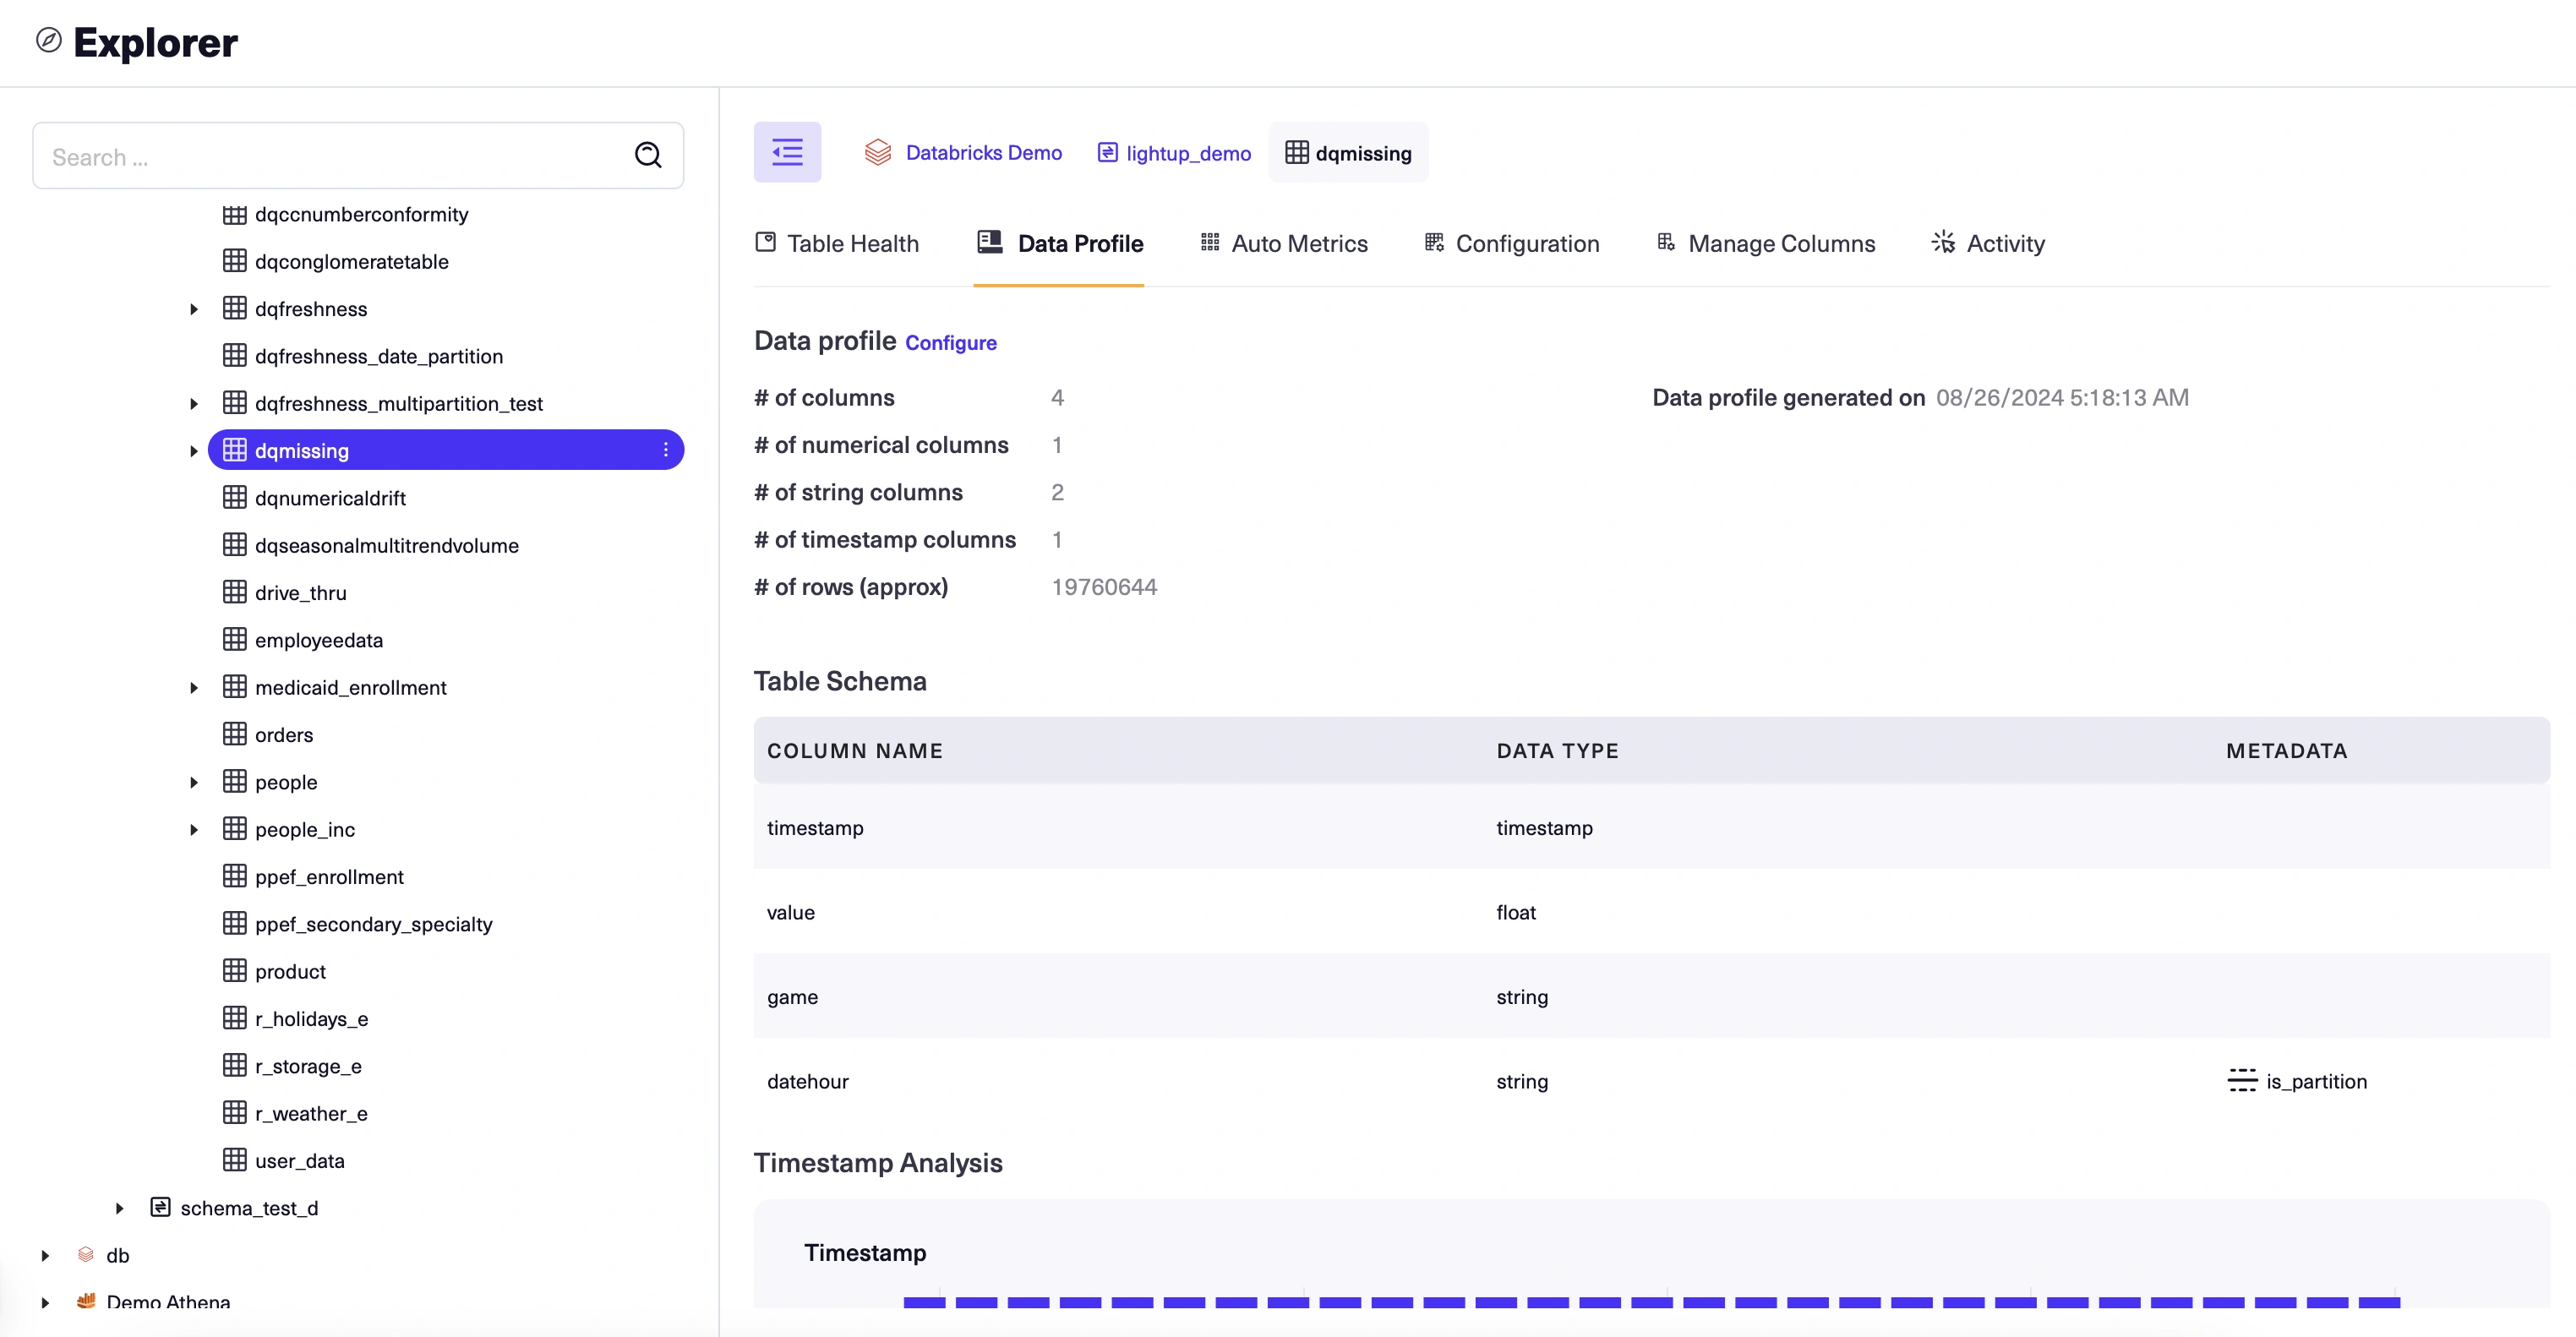
Each data profile is laid out in sections: Data profile, Table Schema, Timestamp Analysis, Sample Data, and profiled columns (section not labeled).
Data profile
The Data profile provides a list of basic facts about the table, as well as when the profile was generated.
You can also generate a new profile, replacing the current one. Only one data profile can exist for a table— there's no way to save a copy of or export a data profile.
Generate a new profile
- In the profile, next to Data profile select Configure. A subform appears just above the table summary.
- Select a Mode:
- Full Table - Use the entire table to create the data profile.
- Random Sample - Use one million randomly-selected rows to create the data profile.
- Time Range - Specify a period of time and a timestamp column, then use all rows having timestamps within that period to create the data profile.
- Select Update to generate the new profile.
Table Schema
The Table Schema section displays a list of the table's columns. For each column, it lists the column name, data type, and any detected metadata (currently, is_Indexed and is_PartitionKey are detected).
Timestamp Analysis
The Timestamp Analysis displays a chart showing the row count (y-axis) associated with each timestamp value on the x-axis. You can hover over a timestamp value on the chart to see more details.
Below the chart is the timestamp data delay, which is the profile collection time minus the maximum timestamp value in the profiled data.
Sample Data
Five rows of sample data are displayed to help you understand the table's contents. Data for all columns is included— you might need to scroll right to review them all.
Profiled columns
Profiles for the table's timestamp, string, and numeric columns are displayed below the Sample Data, in the order they appear in the table. Columns with other data types are not profiled. Each column profile includes statistics about the column's data based on its data type. In addition, if Lightup detects a pattern in a string column, that pattern is noted in the column's profile. Note that more than one pattern might be detected— all detected patterns are listed in the profile.
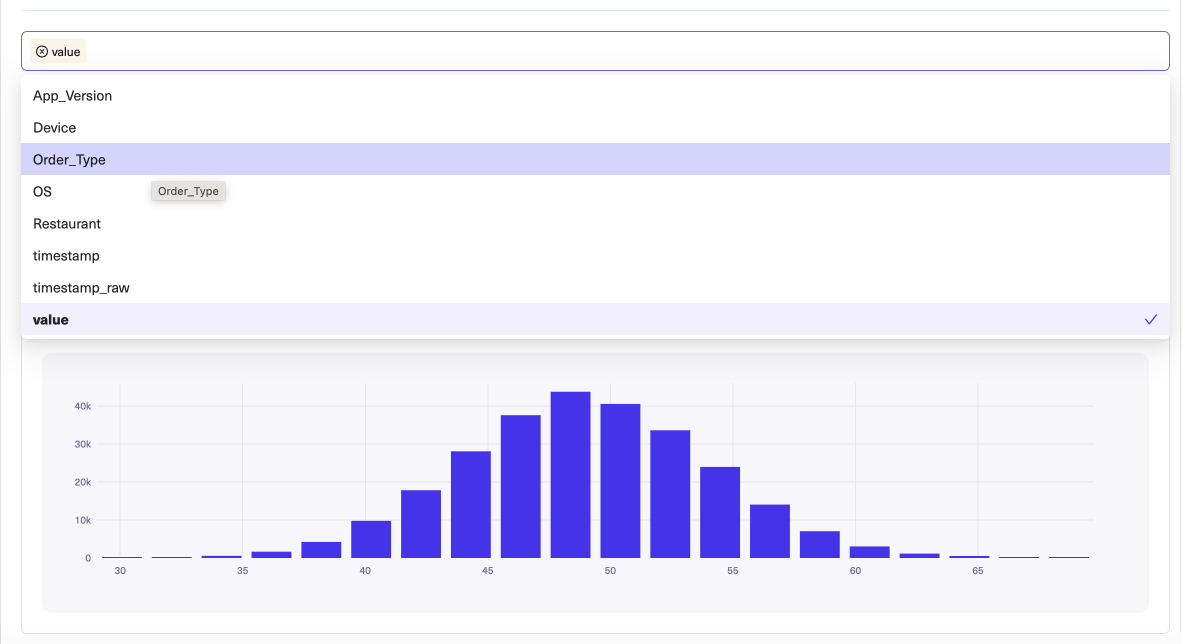
To select specific profiled columns to display, click Select column name and then choose columns from the list that appears.
Column profile information
All column profiles display percentages of Valid and Invalid column values. Valid values are further broken down into Unique and Nonunique percentages. The only Invalid values are nulls (absent data), so Null is equal to Invalid. The sum of Valid and Invalid is always 100%.
- Numeric column profiles display the Min, Lower quartile (Q1), Median, Mean, Upper quartile (Q3), and Max values (standard statistics that describe the distribution of values), a graph , as well as the percentages of column values that are Zero %, Positive %, Negative %, and Nan% (not a number). Below these statistics is a value-distribution chart for the column.
- String column profiles display the Max string length, Min string length, and Mean string length, as well as the Zero Length Count (the count of column values having zero length strings), any Patterns Detected, and the # of Distinct Values (i.e., COUNT DISTINCT). Although there is no limit on the number of distinct values in a column profile, if there are fewer than 50 distinct values a chart displays the distribution of the top 20 values.
- Timestamp column profiles display the Mean Interval (the average time elapsed between two consecutive timestamps), Min Interval (the smallest amount of time elapsed between two consecutive timestamps), and Max Interval (the largest amount of time elapsed between two consecutive timestamps), the Min Timestamp, the Max Timestamp, and the Future Date % (the percent of values where the date is in the future). Below these statistics is a chart of recent timestamps— you can hover on the chart to see details.
Updated 11 months ago