
Release notes
4.23 (22/09/2025)
- Performance & Enhancements: Genie responses improvement, Query history cleanup improvement
- Bug fixes: Compare aggregate metrics percentage error round off, UI crash fix
4.22 (08/09/2025)
- New api: Added a new bulk api to update incident status, fetch deleted metrics via api
- UI Performance & UX Enhancements: Optimisation of incident listing, details and monitor details
- Bug fixes: Query history page related bug fixes, assorted UI fixes
- Virtual tables: Enabled virtual tables for Redshift
- Incorta MV: Enabled row count and update delay auto metrics for Incorta materialized views
4.21 (17/07/2025)
- Snowflake Key Pair Authentication: Added key pair authentication for enhanced security and compliance with modern authentication standards
- UI Performance & UX Enhancements: Moved metrics and monitors page counters from frontend to backend for faster page loads, added pagination to monitor lists, fixed multiple UI crashes, and introduced Observer role permissions for table sample previews
4.20 (10/06/2025)
-
Configure email integrations with flexible digest schedules: Hourly, Daily, or Weekly
-
Download comprehensive metrics data directly from the dashboard in CSV format
-
Significantly improved load times for Metrics and Monitors listing pages
-
Added key pair support for Snowflake authentication
-
Reduced boot time for faster application initialization
4.19 (05/05/2025)
- Auto configuration is available which can be enabled via the Query governance option . See https://docs.lightup.ai/docs/query-governance
- Assorted bug fixes and general api latency improvement.
4.18 (04/01/2025)
- You can now setup monitors such that they discard bad (outlier) data and only consider training periods where there are no outliers in the metric data. See https://docs.lightup.ai/docs/monitor-a-metric#outlier-detection
- Fixed issues for certain cases where the Lightup explorer page was loading slowly with a large number of metrics
4.17 (03/06/2025)
- Support for left and right outer joins for row-by-row metric. Previously, only a full outer join between source and target was supported.
- Support for monitor approval. Now workspace admins can require approval to make changes to both metrics and monitors https://docs.lightup.ai/docs/monitor-approval
4.16 (01/09/2025)
- Additional metric types supported on Virtual Tables for datasources on which Virtual Tables are supported. See https://docs.lightup.ai/docs/add-virtual-tables-for-relational-datasources#setup-metrics
- Bug fix for issue that was causing hourly summary alerts not to be received with Microsoft Teams integration, and other minor bug fixes
4.15 (12/05/2024)
Features
- Monitor improvement providing ability to add slice specific training periods and alerts. See https://docs.lightup.ai/docs/slice-overrides
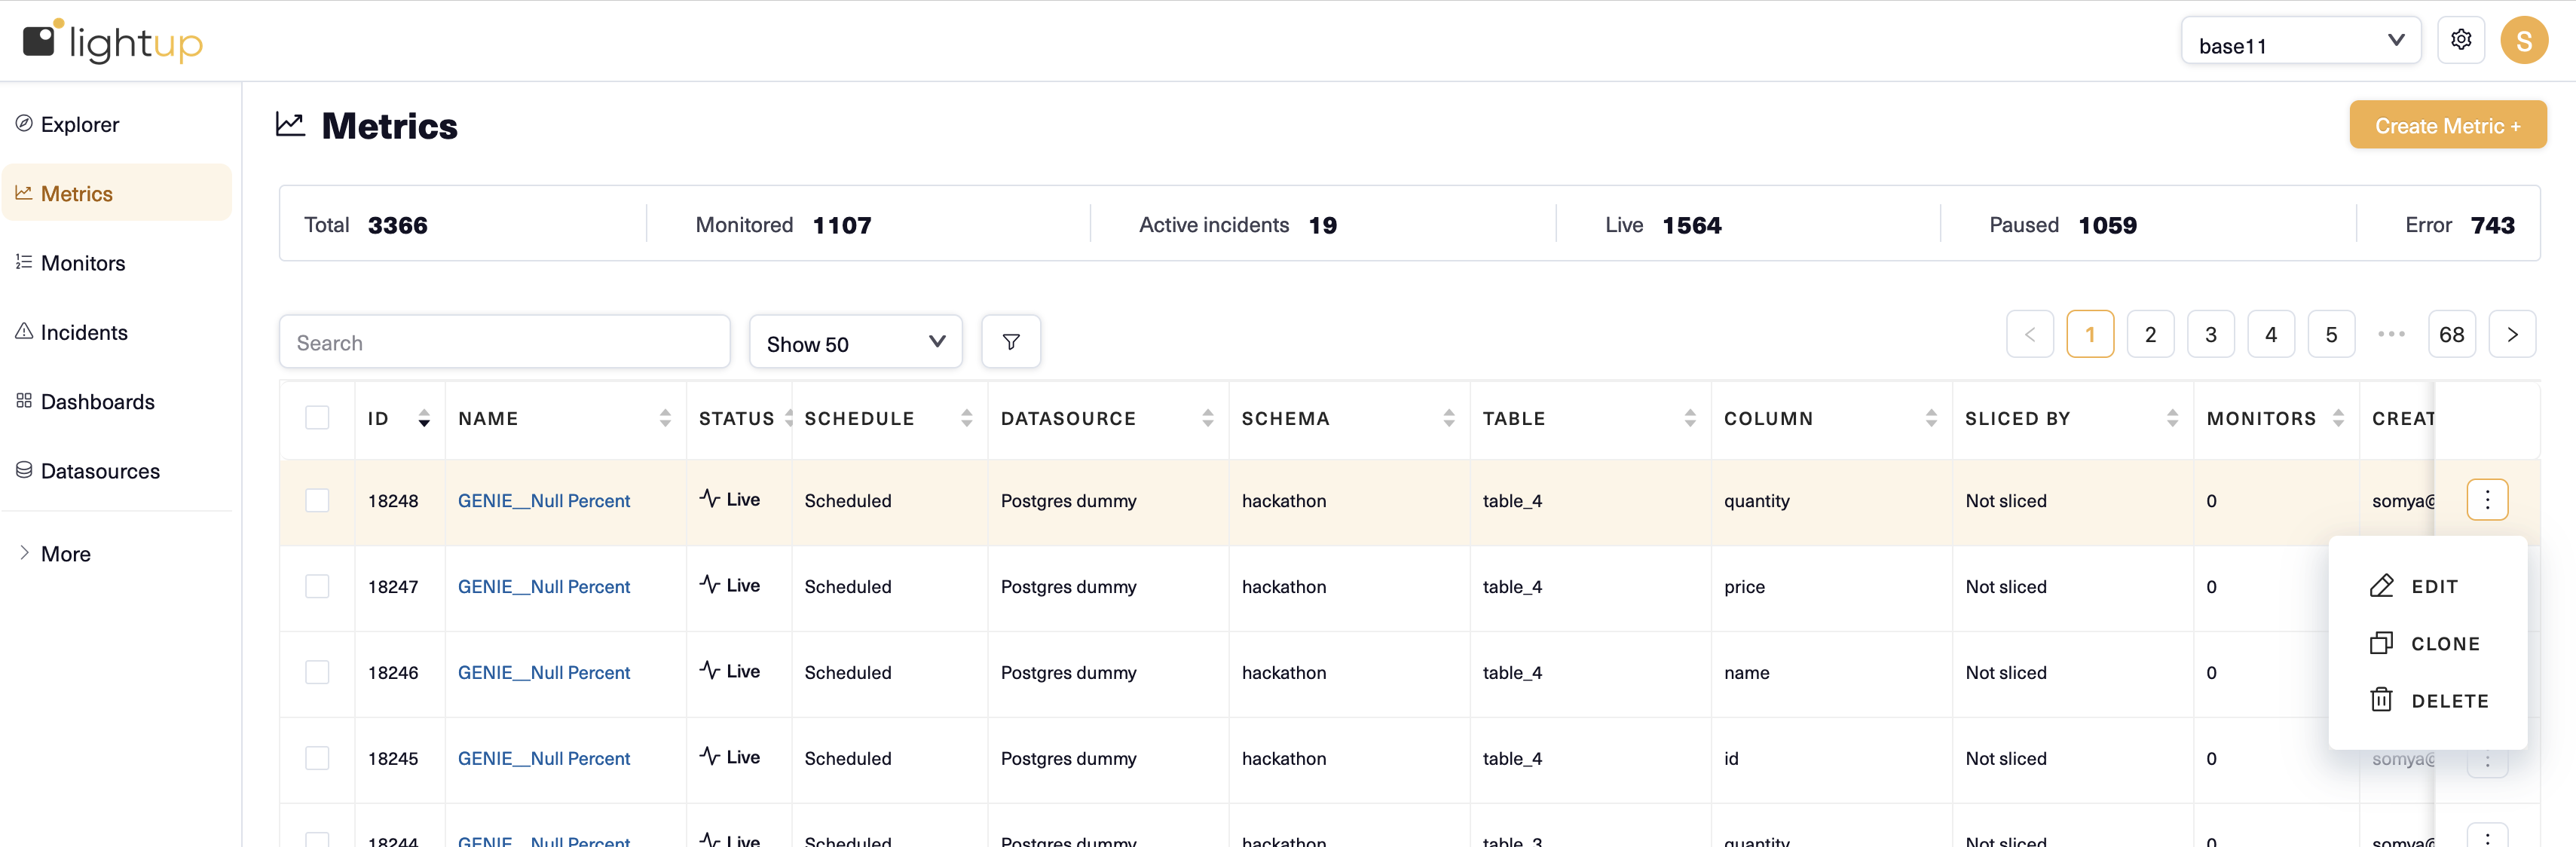
- Minor changes to user interface for improved navigation. Moved action menu items to an overflow menu column on the right on all pages.
- Fixed a bug that was resulting in digest alerts not being sent
4.12 (10/16/2024)
Features
- Added Virtual Tables support for Snowflake and Databricks with row-by-row metric
- Added support for custom seasonality for custom SQL metrics
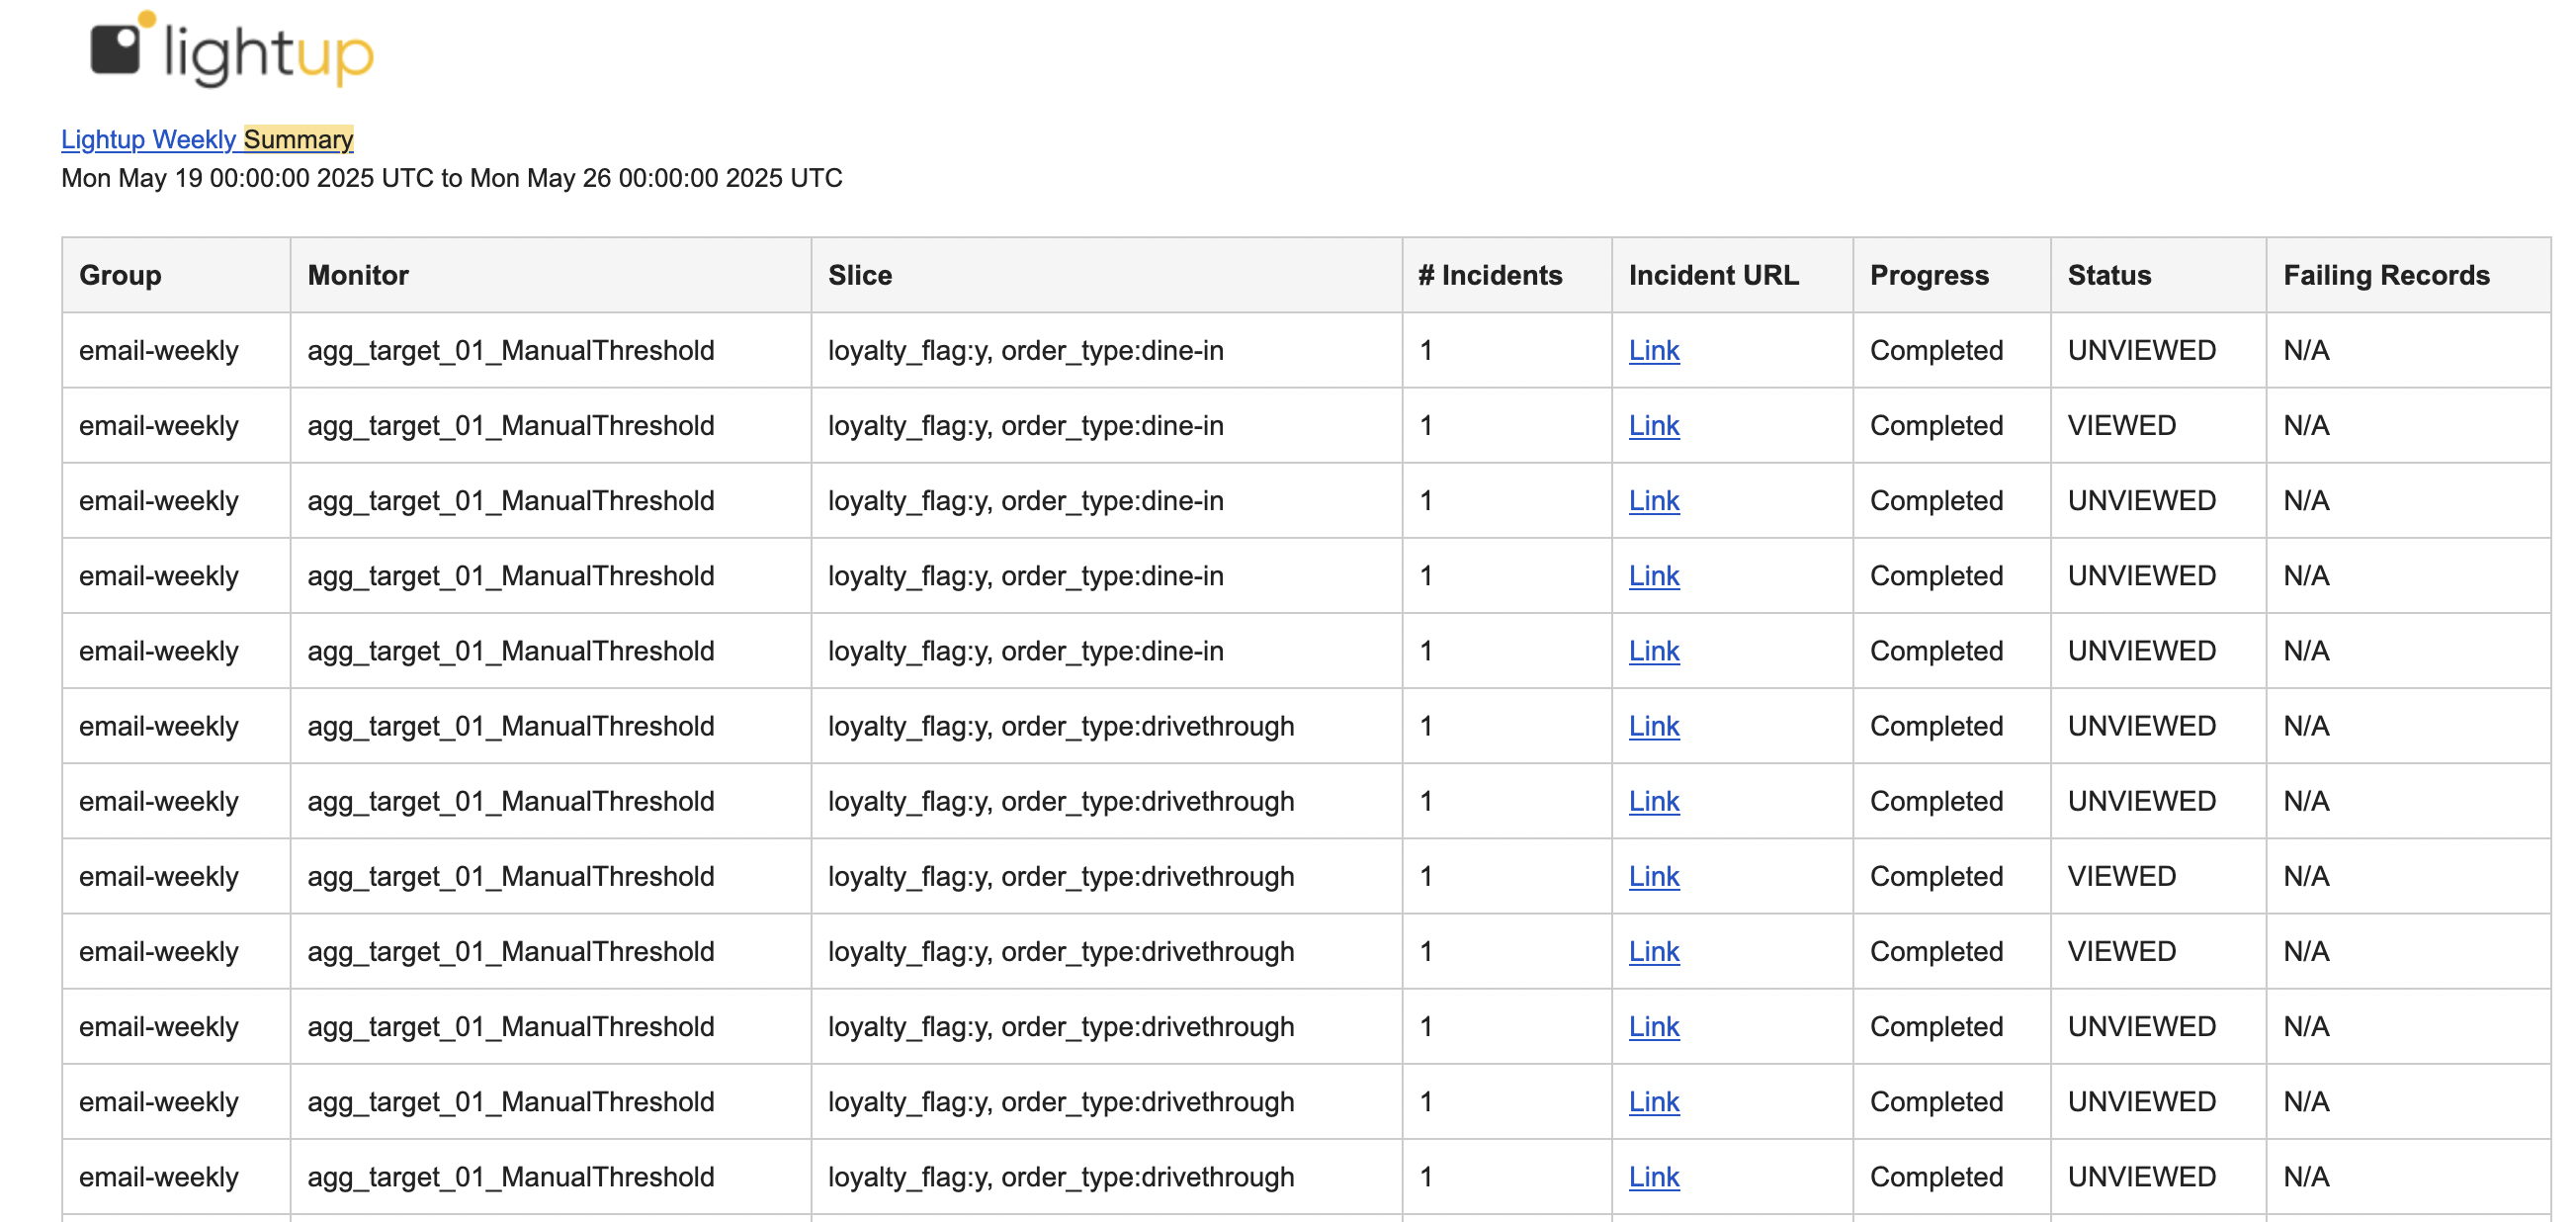
- Added "Failing records count" as a column on the incidents list page. This allows users to see the count of failing records for incidents that have failing records and to sort incidents by this count.
- Added "Select all" across pages on the Schema "Table configuration" tab
4.11 (10/04/2024)
Features
-
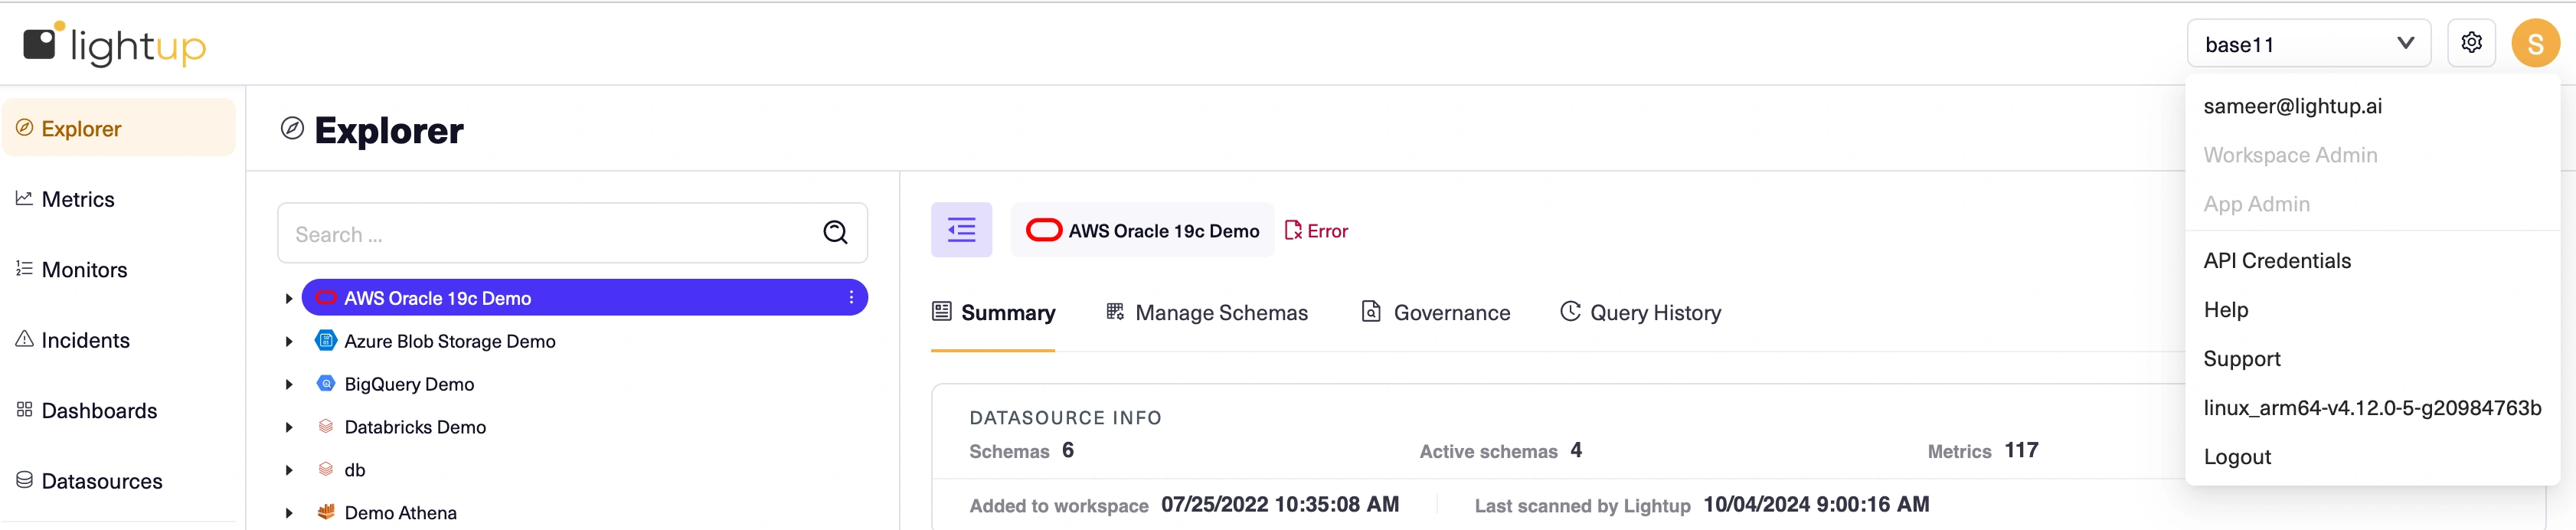
Introduced a new home page UI that changes user navigation on the home screen
-
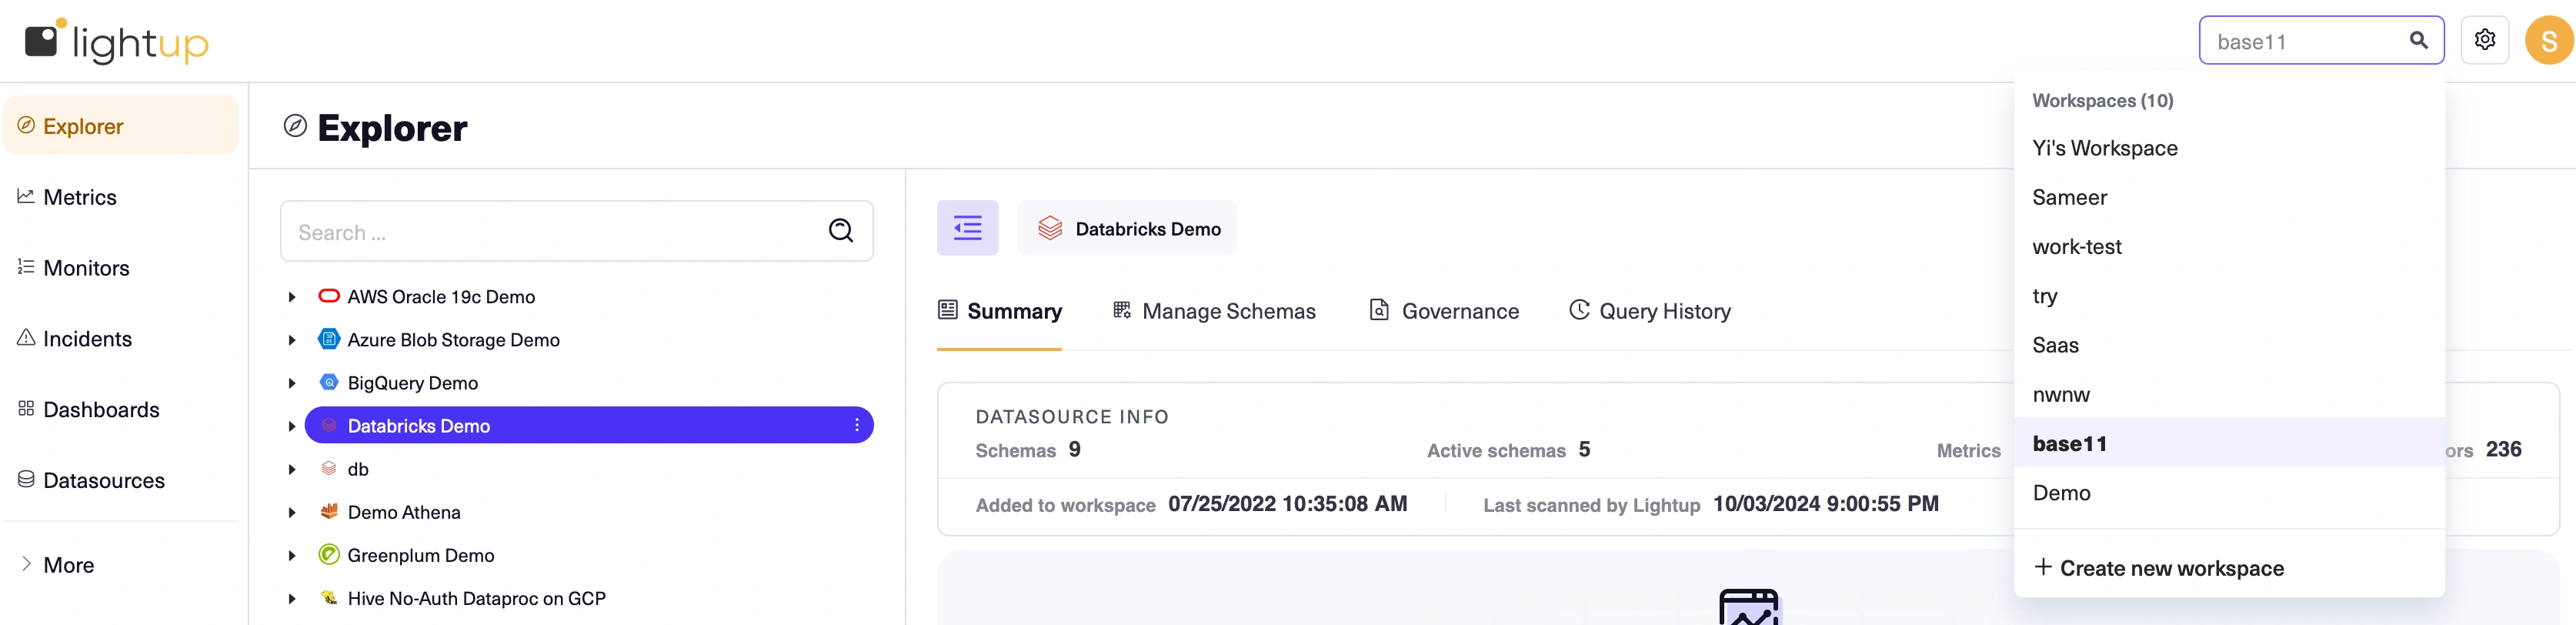
Switching between workspaces can now be done from the top panel on the right
-
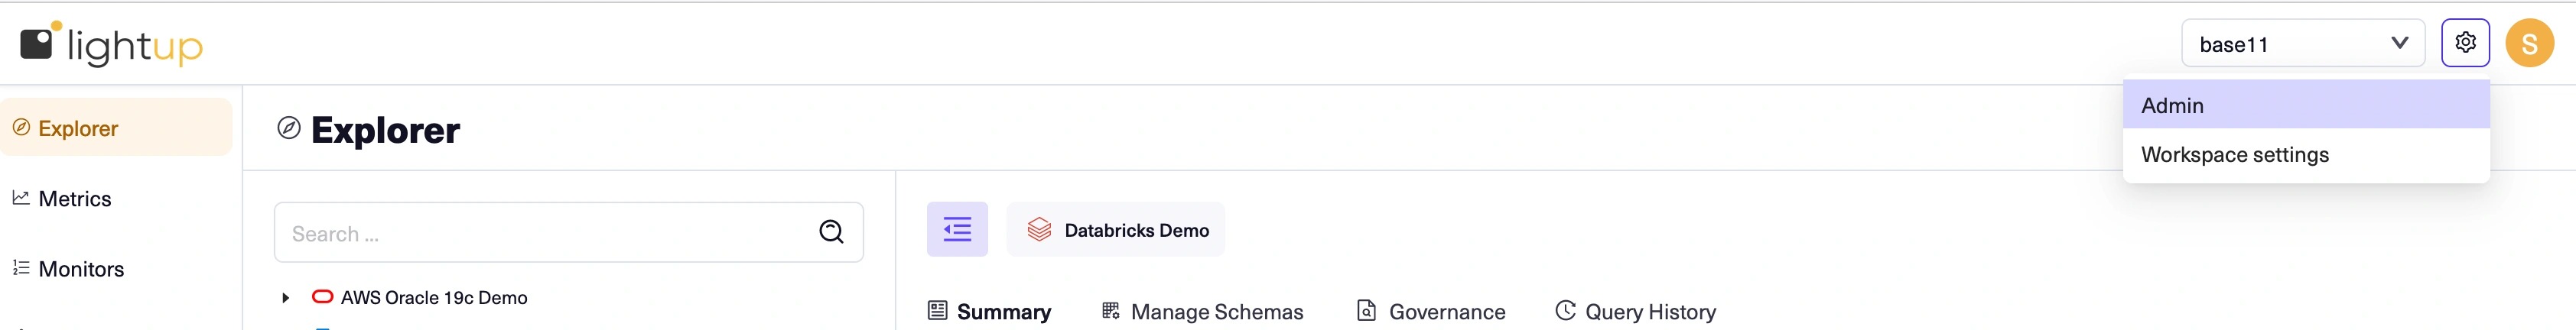
Admin (App admin actions) and workspace settings can be accessed using the config icon on the top panel
-
The username icon on the top panel has other user actions and also lists user roles
-
Navigation for data quality related actions such as explorer, list pages for metrics, monitors and incidents, dashboards and datasources can be accessed on the left panel
-
-
Other features
-
Audit logs are now support for tables and views (previously this was only supported for virtual tables)
-
Filename of the downloaded output of failing records now contain metric UUID or metric name
-
Incident validation is possible for full table metrics
-
Query governance and history are now available as tabs on individual datasources in explorer
-
4.10 (9/11/2024)
Features
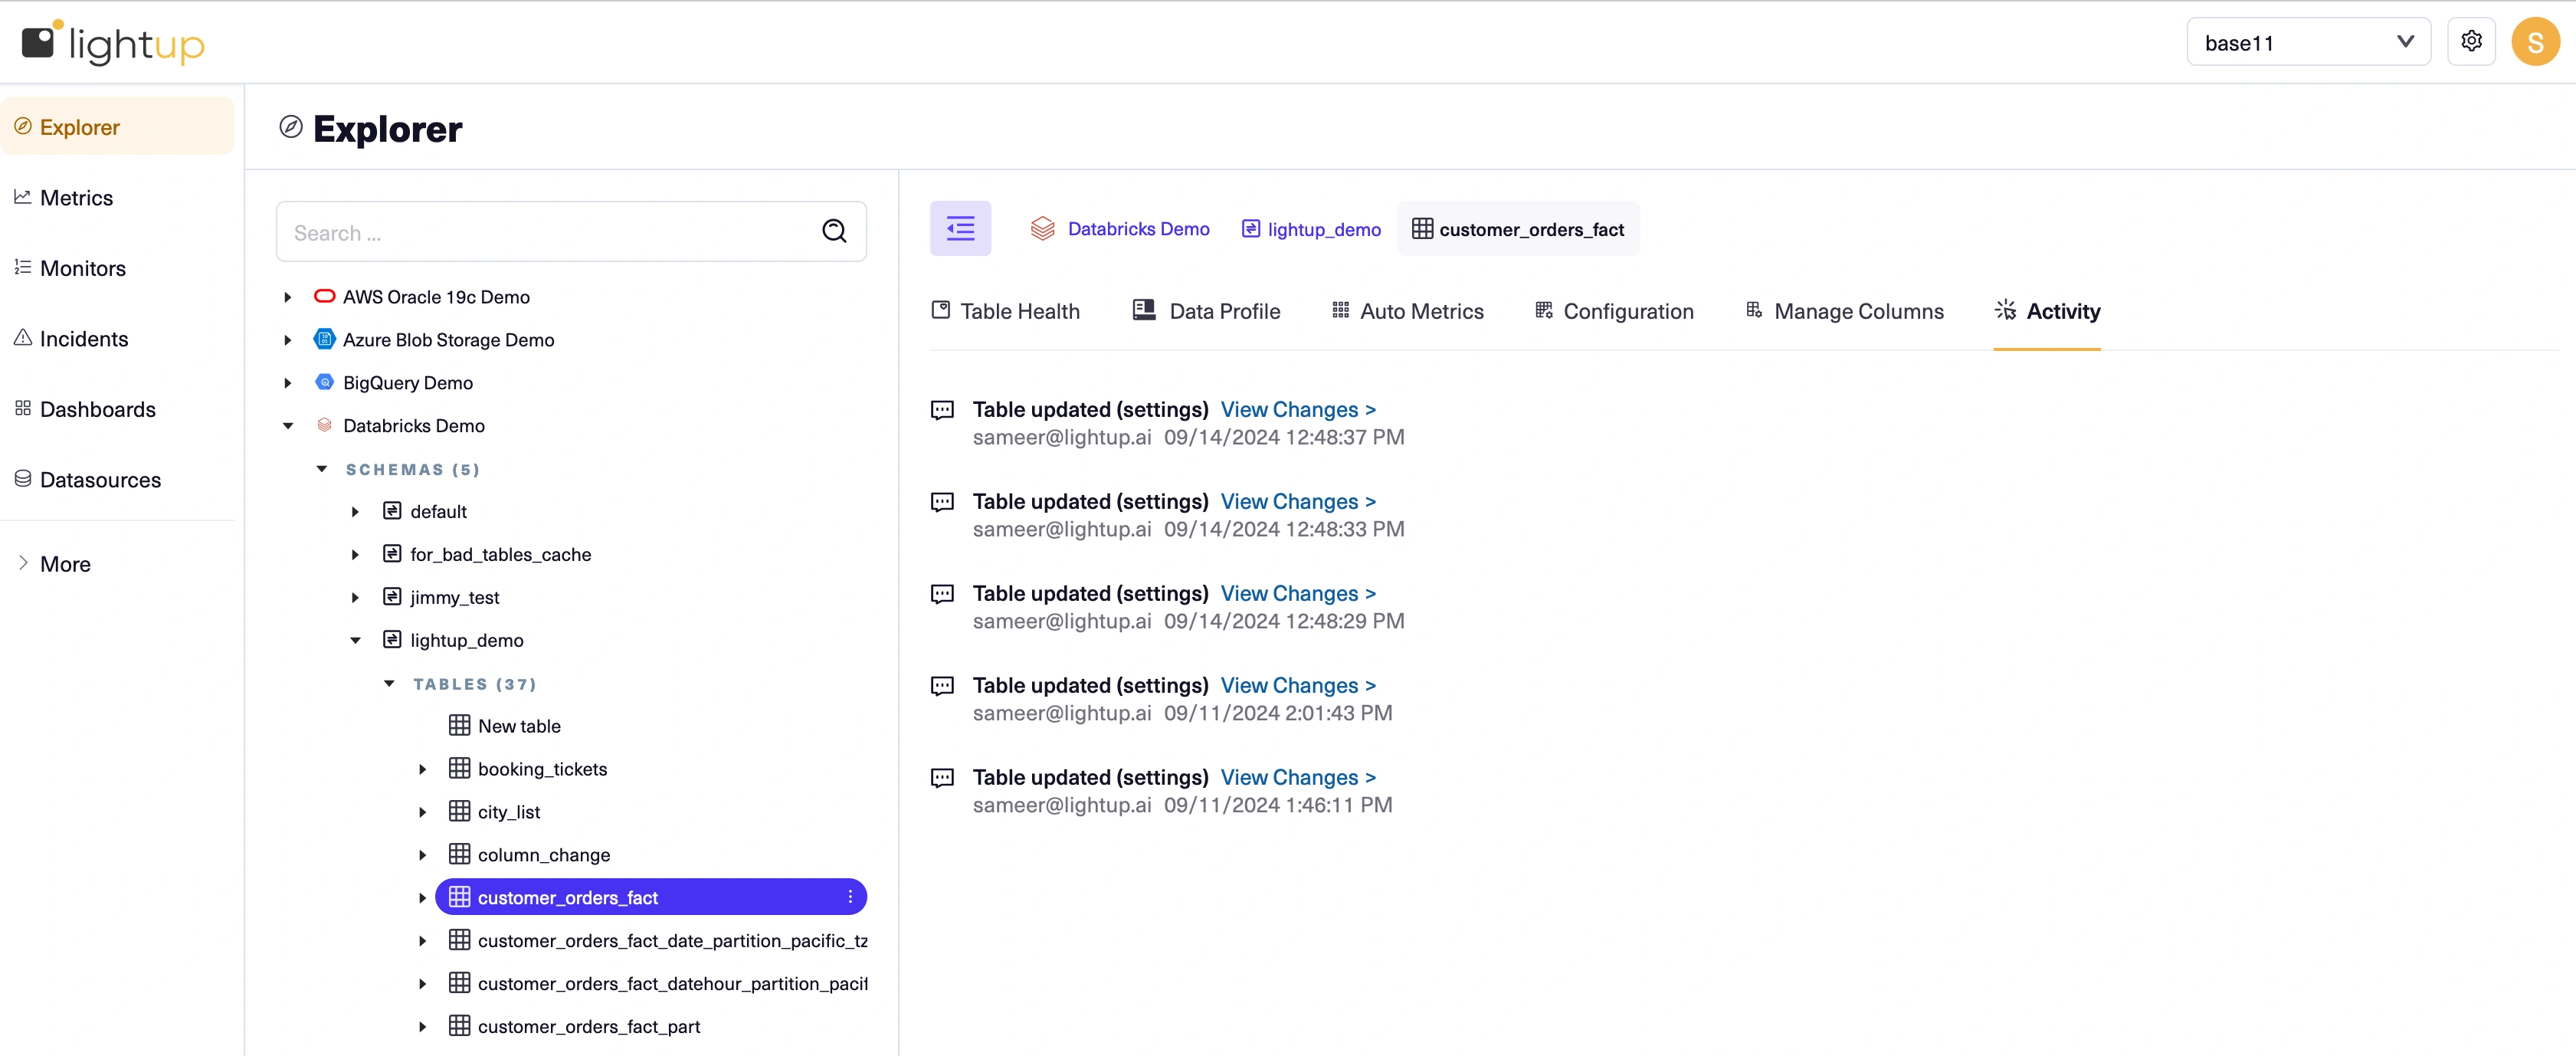
- Added support for Audit logs for Virtual tables. Now you can see the change history that includes username, timestamp and changes to the configuration (including changes to the SQL). See documentation
- Added support for Virtual Tables for Incorta with row-by-row metrics
4.9 (9/3/2024)
Features
- Added a governance capability that will enable workspace admins to require editors to seek approval before they make changes to metrics. See our documentation for more details
- User experience improvements
- Redesigned workspace tab to separate users and settings
- Redesigned query governance tab to separate query history and settings
4.8 (8/15/2024)
Features
- Added support for Data Profiling for Virtual Tables
- Made improvements to memory allocation during schema scans to improve system performance
- Some user experience improvements
- .Explorer tree can be collapsed for more horizontal space to view charts and configuration
- Minor UI improvements to make summary information easily available for schemas and tables
4.7 (7/31/2024)
Features
- Added support for Virtual Tables. This capability is useful if you want to create data quality checks on tables that you define in Lightup using SQL. Normally you would create views on the datasource and let Lightup discover the view when it scans the datasource. However, sometimes you may either not have the permissions to create views on the datasource or you may not want to create views directly on the datasource. This capability gives you the flexibility to do that inside Lightup.
- Only row by row custom metric is supported
- Only certain auto metrics are supported
- Only works on Oracle and Postgres
You can see the documentation on Virtual tables for more details
4.6 (7/18/2024)
Features
- Fetch the count of failing records in an incident automatically
- Introduction of a new query governance flag "Enable failing records count cache" that allows the count of failing records to be fetched and cached automatically. This flag is disabled by default. When disabled, the user has the option to use the "Get count" option inside the failing records tab of an incident to retrieve the failed records manually.
- When the query governance flag is enabled, the count of failing records for an incident is automatically fetched
4.5 (7/2/2024)
Features
- Support for Materialized Views on the following datasources.
- Snowflake
- Databricks
- AWS Redshift
- Google BigQuery
- Removal of the default "ORDER BY" clause in the failing records SQL for an Incident, so that users may then use their own "ORDER BY" statements to retrieve failing records
4.4 (6/26/2024)
Features
- Onboarding process improvements - revised interfaces for activating and configuring schemas, tables, and columns.
- Pause datasource functionality - a datasource can be paused from the datasource menu. This will pause all metrics underneath.
- Added support for recurring alerts - this can be toggled on in integration settings to send a email if an incident persists out of bounds on new metric collections.
4.3 (5/30/2024)
Features
- Added support for external tables for Redshift
- Added a datasource onboarding checklist (top right of summary tabs in explorer) for easier tracking of setup actions
- Revised interface for enabling autometrics to better support bulk actions
Improvements
- Support for <, >, <=, >= for timestamp columns in low-code editor
- Support for custom schedules in compare aggregate metrics
- Improved Jira error messages for better troubleshooting. We will now mirror the error received from Jira if the integration fails.
- Fixed bugs in schema scans
4.2 (5/16/2024)
Features
- Support for end incident action
- Support external tables for BigQuery, Snowflake and Databricks
- File system events when there are integration errors.
- Search improvements - ID filter for data source and strict matching to resolve discrepancies between custom dashboards and associated report pages
- Support for custom field Lightup DQ Score in Alation
- Added optional garbage collection to keep up older query history, system events, data points for deleted metrics (this is behind a feature flag and can be enabled by your support team if necessary)
API improvement
- Support filtering by updated_ts for incidents
4.1 (5/1/2024)
Features
- View support added for Oracle, Hive, Athena and Teradata
- Support added for Redshift Serverless
- Low-code where clause conditions updated to include 'In column' and 'Not in column'
- Updated monitor training logic to automatically identify, wait, and retry training when there is not enough data initially. The training status will reflect the monitor is waiting for additional data in this scenario. Previously, the system would error out if there was insufficient data in a period and require user intervention.
- Re-enabled on-premises Jira support
Improvements
- Schema scanning failures will not cause the rest of the scan to fail
- Added system events when there are insufficient resources for pods (ie. pods are in pending state for a long time).
- Added support for Teradata logmech credentials
- Allow viewers to update incident status to viewed when they load it
- Allow profiling to be rerun on a full table metric
- Support pagination on manage schemas, tables, columns page
API changes
- /usage endpoints changed from GET to POST since there were several arguments that it needed to support.
4.0 (4/17/24)
Features
- Low code metrics now support more complex where conditions - you can specify individual numbered conditions and then choose to AND, OR, Custom combine them together. Custom will let you specify a complex combination, such as (1 AND 2) OR 3
- Casting support was enhanced across all datasources (except file-based sources) to allow automatic casting of numeric to string data types and vice versa. This will affect results in the data profile, distribution metrics, and available low-code operators.
Improvements
- Custom schedules are now available on full-table metrics
- A navigation breadcrumb trail was added to the incident page
- Error messages (such as when debugging a custom SQL validation) now have a copy icon to copy the error text to your clipboard
3.25 (3/31/24)
Features
- SAP/HANA datasource support is available - please contact support if you would like this enabled in your environment.
- Column masking is now available! From a table's 'Manage Columns' interface, you can choose to mask columns, preventing them from outputting raw data within Lightup (in data profiles, sample data, and failing record queries).
Improvements
- Introduced two new toggles to the Query Governance section:
- Enable Data Storage: Allows Lightup to save row level details currently used in storing row-by-row comparison failing records. This data can be viewed from the metric and downloaded as a csv.
- Enable Data Samples: Disables capabilities that display row level data (sample data and failing record data)
- Increase max slice count to 60k
- When bulk editing metrics/monitors/incidents a selection banner now shows the number selected across pages and a quick clear option.
Changes
- Missing value filling only supports null and zero filling. Previously we supported nan which was found to be no different than null in practice. All metrics that had nan configured will be migrated to using null missing value filling.
- Minor efficiency improvements and security patches.
3.24 (3/14/24)
Enhancements
- Multi-column slicing: you can now leverage multiple columns when adding slicing to a metric.
- List search improvements: The list search has been overhauled on metric, monitor, and incident list pages to support more fields. You can add filters from the search dialog box by typing and/or scrolling
Bug Fixes
- Incident validations where no data is present are no longer marked as successful
- Added infrastructure monitoring to identify stuck alert channels
3.23 (2/29/24)
Enhancements
- The left pane is now resizable via drag.
- An optimization has been put in place to avoid “waking” the datasource when a SQL metric is edited. Previously, editing a SQL metric would access the datasource to identify the values for the Columns input. This access will no longer be made when you first edit a SQL metric. Instead, if you need to view the columns, at the time you open the Columns dropdown you’ll be prompted to first validate your SQL.
- Query scope for metadata metrics is now displayed as “metadata”, to indicate that the scope of the data queried is from metadata tables.
- System event notifications now include the workspace name.
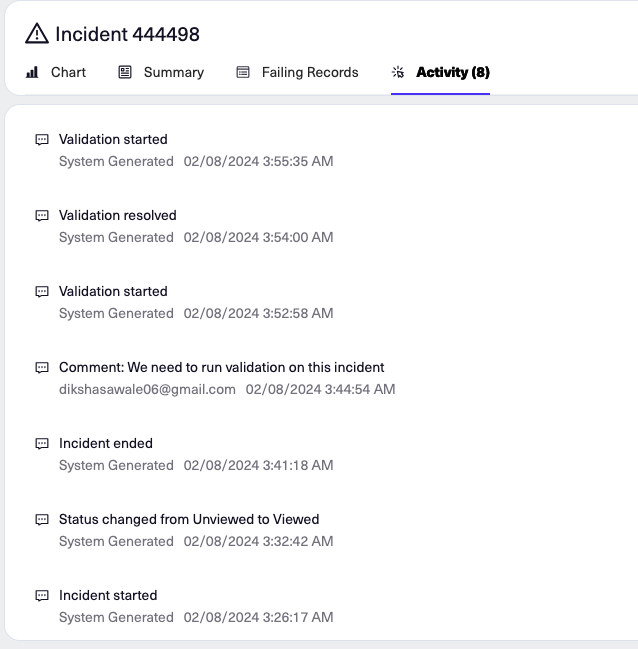
- Minor updates to format of the incident Activity tab:
- Comments are now prefaced with “Comment:”.
- Activities now include the name of the user who generated them. (System-generated activities contain no username.)
3.22 (2/15/24)
Enhancements
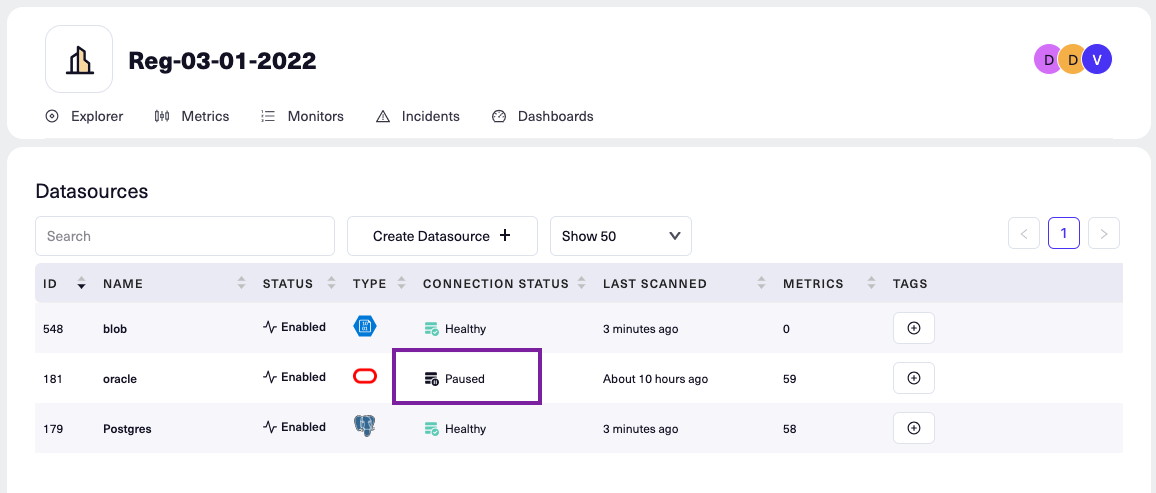
- If a datasource is paused by a schedule, Connection Status in the Datasources List will now reflect this status:
- The incident activity tab of incident analysis now contains the full history of an incident. This includes when it started, ended, any status changes or validation performed, and comments.
- The BigQuery datasource now supports views.
- Activity metrics can now be deleted, similar to all other metrics. Note: improvements in this area are still underway. In a future release you will be able to edit, pause, and resume these metrics.
Bugs
- An issue was fixed that restricted the user from specifying a limit on a failing record query on a full table metric. This has been fixed.
3.21 (2/1/24)
Enhancements
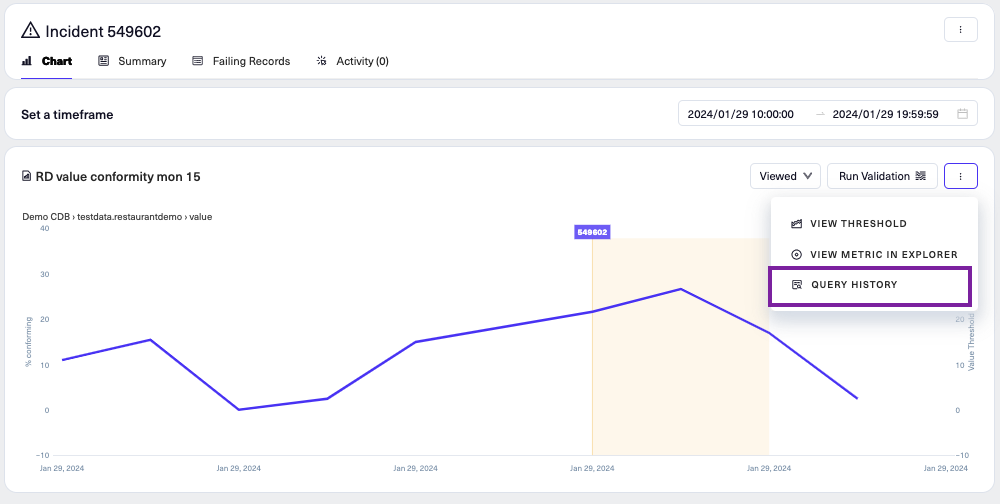
- Query history: You can now access the query history for a metric from both Explorer and Incident Analysis. From Explorer, click on the Metric menu to find the Query History menu item.

Similarly from incident analysis, click on the incident’s “...” menu:
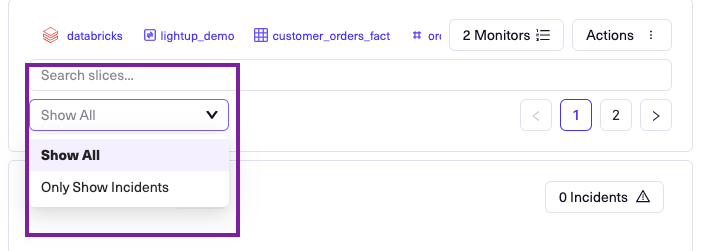
- Filtering for slices with incidents: On a sliced metric, you can now select “Only Show Incidents” in Explorer to filter for only slices with incidents:
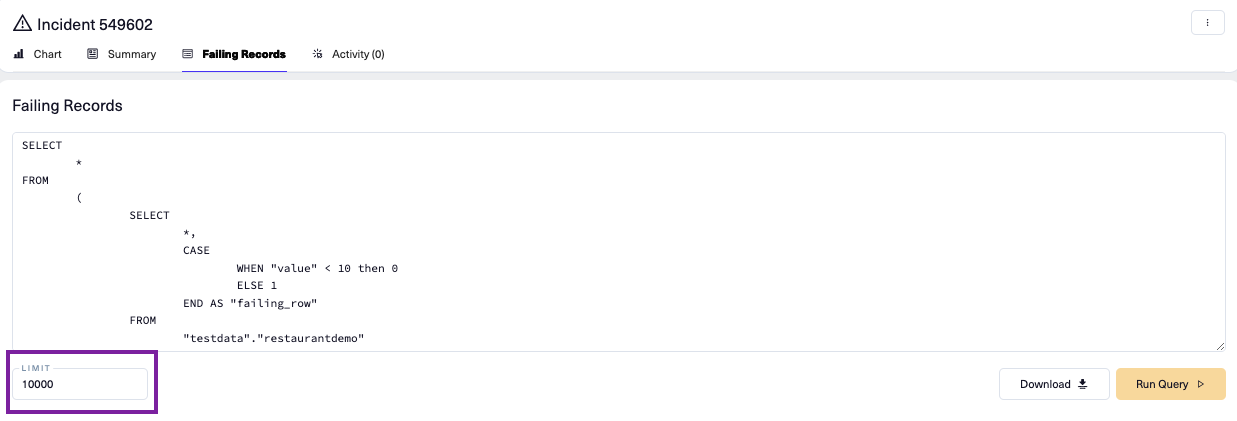
- Failing records
- Failing records generated from a failing records query can now be sorted by column
- You can now download up to 10,000 failing records. To specify the number of records to download, enter a number in the new Limit input box, click Run Query, then Download. Note that the records beyond 100 can be downloaded, but cannot be viewed in the UX.
-
Table Activity, Column Activity, and Category Activity metrics:
Previously these metrics did not show up in the metric list - you will now see them there. You can additionally view details of the metrics via “Edit metric”. Note: improvements in this area are still underway. In a future release you will be able to delete these metrics from the metric list and edit the metric from “Edit metric”. Currently you can edit some fields but you will not be able to save the changes. -
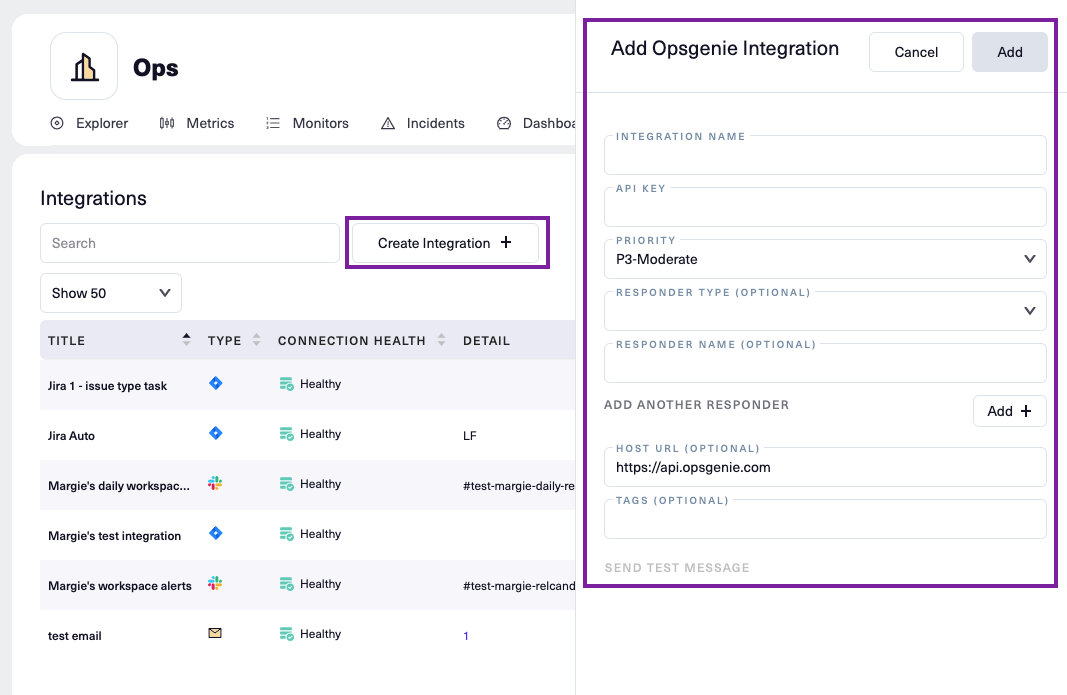
Opsgenie: You can now integrate Lightup with Opsgenie
- Databricks Unity: Databricks Unity catalog support has been added to Databricks Partner Connect
3.20 (1/18/24)
Enhancements
- Assignee field for Jira integration can now be selected via an autocomplete field that searches for assignee by name.
- Up to 10,000 failing records can now be downloaded to a csv file.
Deprecations
- We are no longer supporting Enterprise on-prem Jira servers (which has been end-of-lifed). Only cloud Jira is supported.
3.19 (12/29/23)
Enhancements
- Lightup’s new System Events panel provides an improved user experience for viewing asynchronous events that occur during system operation. Events are categorized by level - Error, Warning, or Info. You’ll find the System Events menu under your workspace in the left panel - where “Alerts” used to be. To see details of a system event, click on details and a slide in will appear with details of the errors. Fields in the “Info” section of the details slide in can be clicked on to take you to the object referenced.

You can be notified of system events in a manner similar to the notification system for incidents. From the System Events Configuration tab, select Error, Warning or Info and then select an alerting channel.

The Lightup System Events documentation contains more details, including the list of events that are logged in the System Events panel.
- The Schedules UX has been improved - it now provides a more intuitive UX, particularly for the case where the schedule “never ends”
- Last login has been added to the admin Users page, allowing you to see when a user last logged in to Lightup.
- Clicking on Edit Datasource in Explorer now takes you directly to editing the datasource. Previously it took you to the datasources list page.
- Issues related to paused datasource causing an error popup have been fixed. If a datasource pause causes a query to fail (for example, sample data during preview or in a data profile), the chart will now reflect the reason, rather than an error popup.
- The UX for filling in the lower and upper thresholds in the manual threshold modal has been improved.
- Query Governance “Enforce Sort Key Timestamps” language will now reflect the terminology of the datasource.
- A new design for toasts has been introduced. Rather than the red outline box that disappears, you will now see a “color block” popup which requires you to click on it to close.
Bugs
- If incident validation fails after three attempts, an error will be displayed and the metric will be placed into an error state. Previously Lightup continued to try to run validation.
Updated 10 months ago