
Add data assets to Explorer
Explorer enables you to navigate and focus on your data asset hierarchy and see both data profiles and data quality metrics associated with those data assets.
When you connect to a datasource, it appears in the Explorer tree. To populate the rest of the Explorer tree, you select a data asset in the tree and then use its Manage tabs:
- For a datasource, use the Manage Schemas tab to add its schemas to the tree.
- For a schema, use the Manage Data Profiles, Manage Auto Metrics, or Manage Tables tab to add its tables to the tree. Tables are added to the tree when you enable their data profiles or metadata metrics, or when you configure them for deep metrics.
- For a table, use the Manage Columns tab to add its columns to the tree.
Add datasources
At the top of the hierarchy are your datasources. To begin populating the Explorer tree, add your datasources.
Add schemas
-
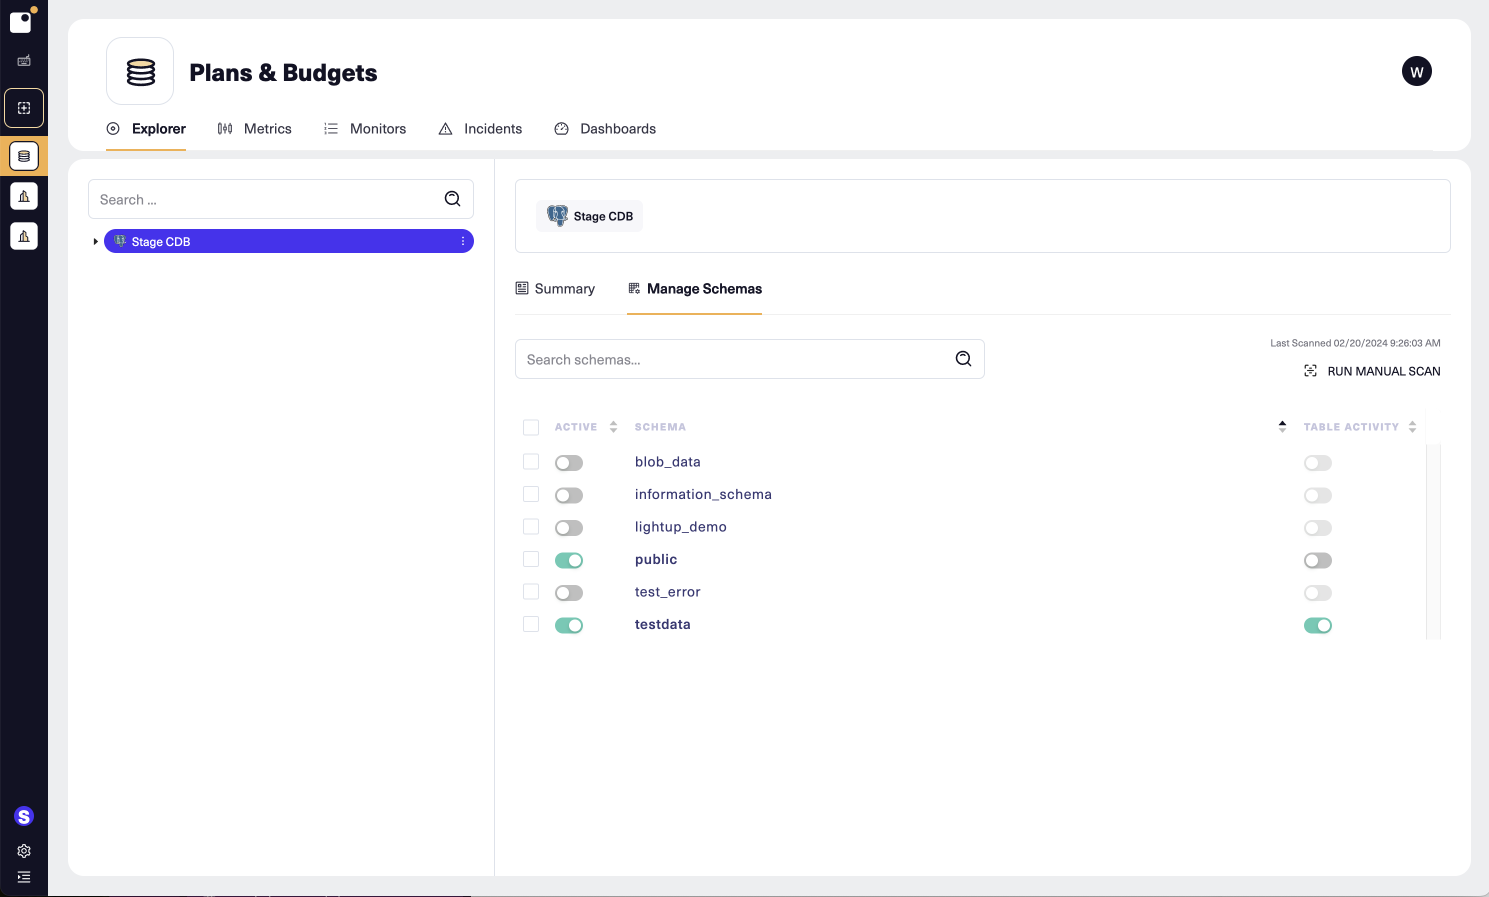
Select a datasource, and then select the Manage Schemas tab.
-
On the Manage Schemas tab, set toggles as needed:
- Use the Active toggle to enable the schemas you want displayed in the Explorer tree.
- If you want Lightup to track table changes in a schema, enable the Table Activity auto metric.
- Bulk operations are available in all Manage <asset>** tabs. To enable or disable a setting for multiple data assets at once, select the check box in the left column for each asset you want to change. Then change the setting in any selected row to update all the selected data assets.
Add tables
There are several ways to add a table to the Explorer tree: enable its data profile, enable any of its metadata metrics, or configure it. We recommend enabling data profiles and/or metadata metrics first to help you understand your tables before configuring them.
Add all tables from a datasource or schema
If you want to add all the tables from a datasource or schema that's already in the Explorer tree, the quickest way is to select the datasource or schema and then use the buttons on its Summary tab to enable all data profiles or metadata metrics. Either action adds all the tables from the selected datasource or schema to Explorer.
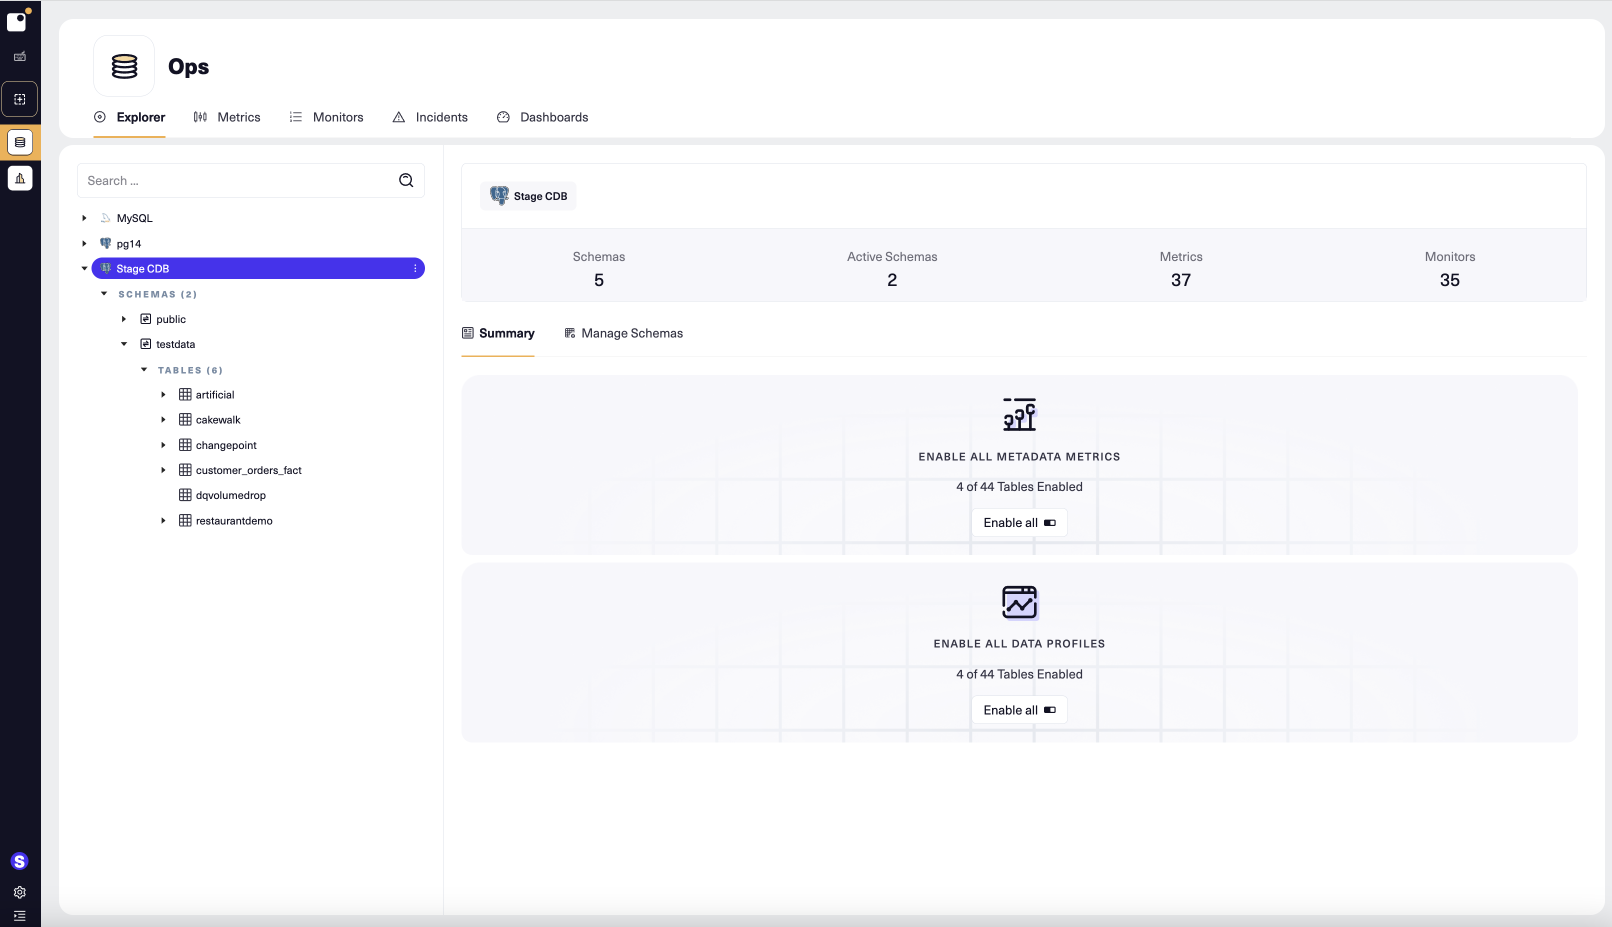
Note that tables inside of inactive schemas aren't added when you use an Enable all button on a datasource. Tables that are already in the tree are unaffected.
Add specific tables from a schema
To add specific tables to Explorer, you can use schema Explorer tabs (Manage Data Profiles, Manage Auto Metrics, Manage Tables) to add one table at a time, or to select several tables and add them at the same time. We recommend you start by enabling data profiles or metadata metrics, so you can get a better idea of how your table behaves before you configure it for deep metrics.
Add tables by enabling data profiling
-
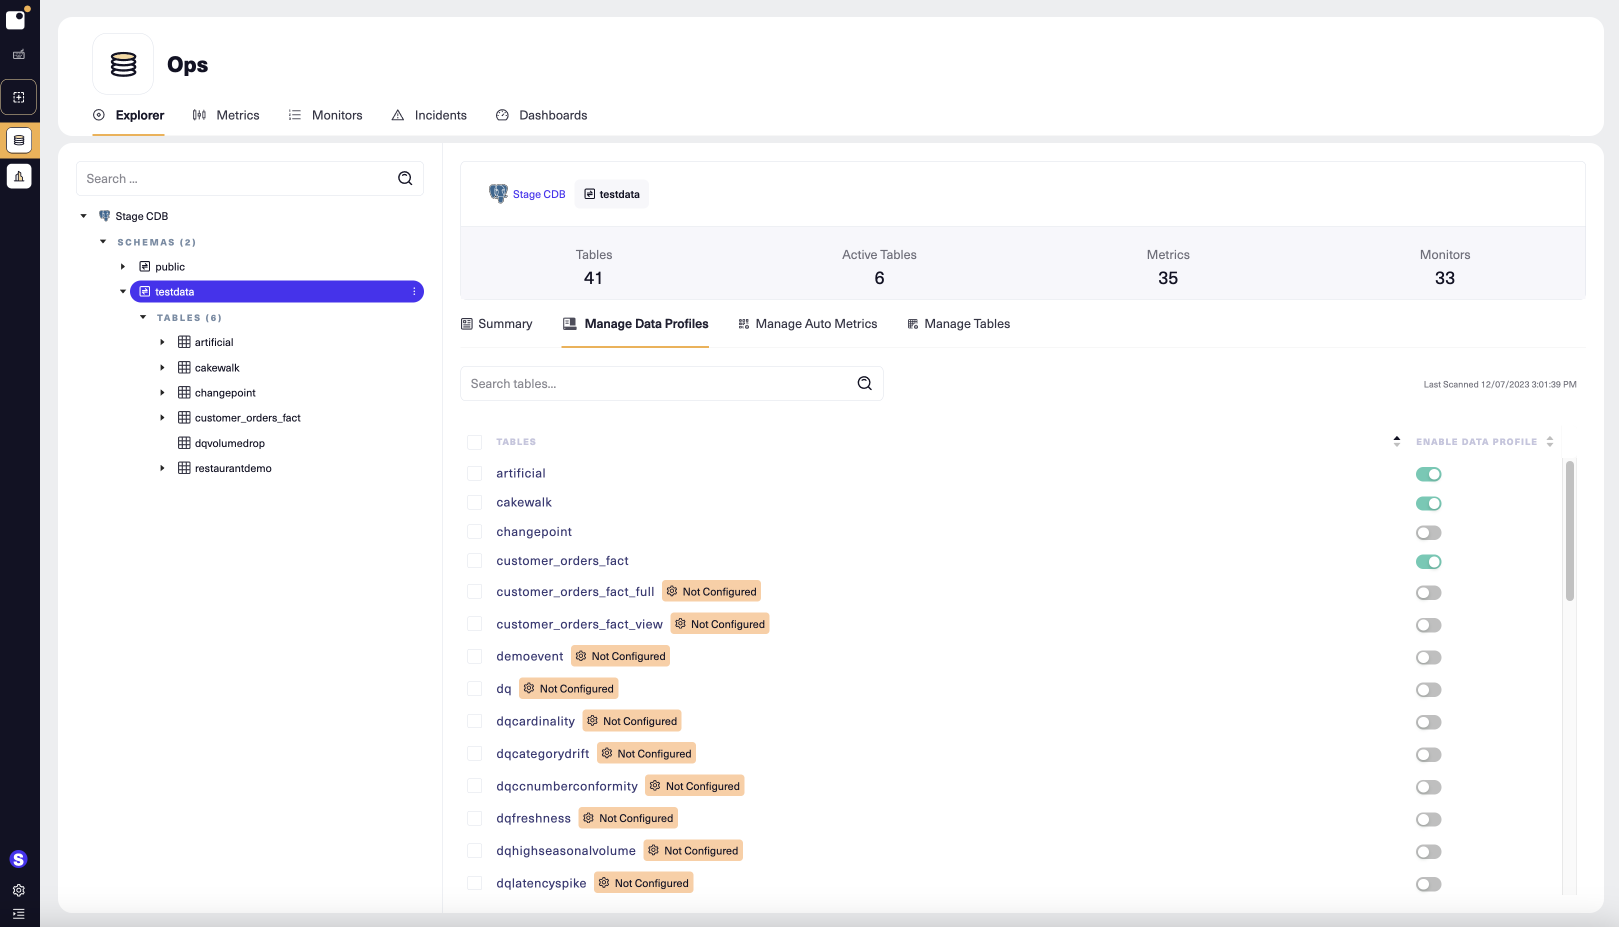
Select the schema, and then select its Manage Data Profiles tab.
-
For each table you want to profile, switch on the Enable Data Profile toggle. Note that you can select multiple tables using the checkboxes on the left, and then enable data profiles for them by switching on the toggle for any of the selected tables.
Add tables by enabling auto metrics
-
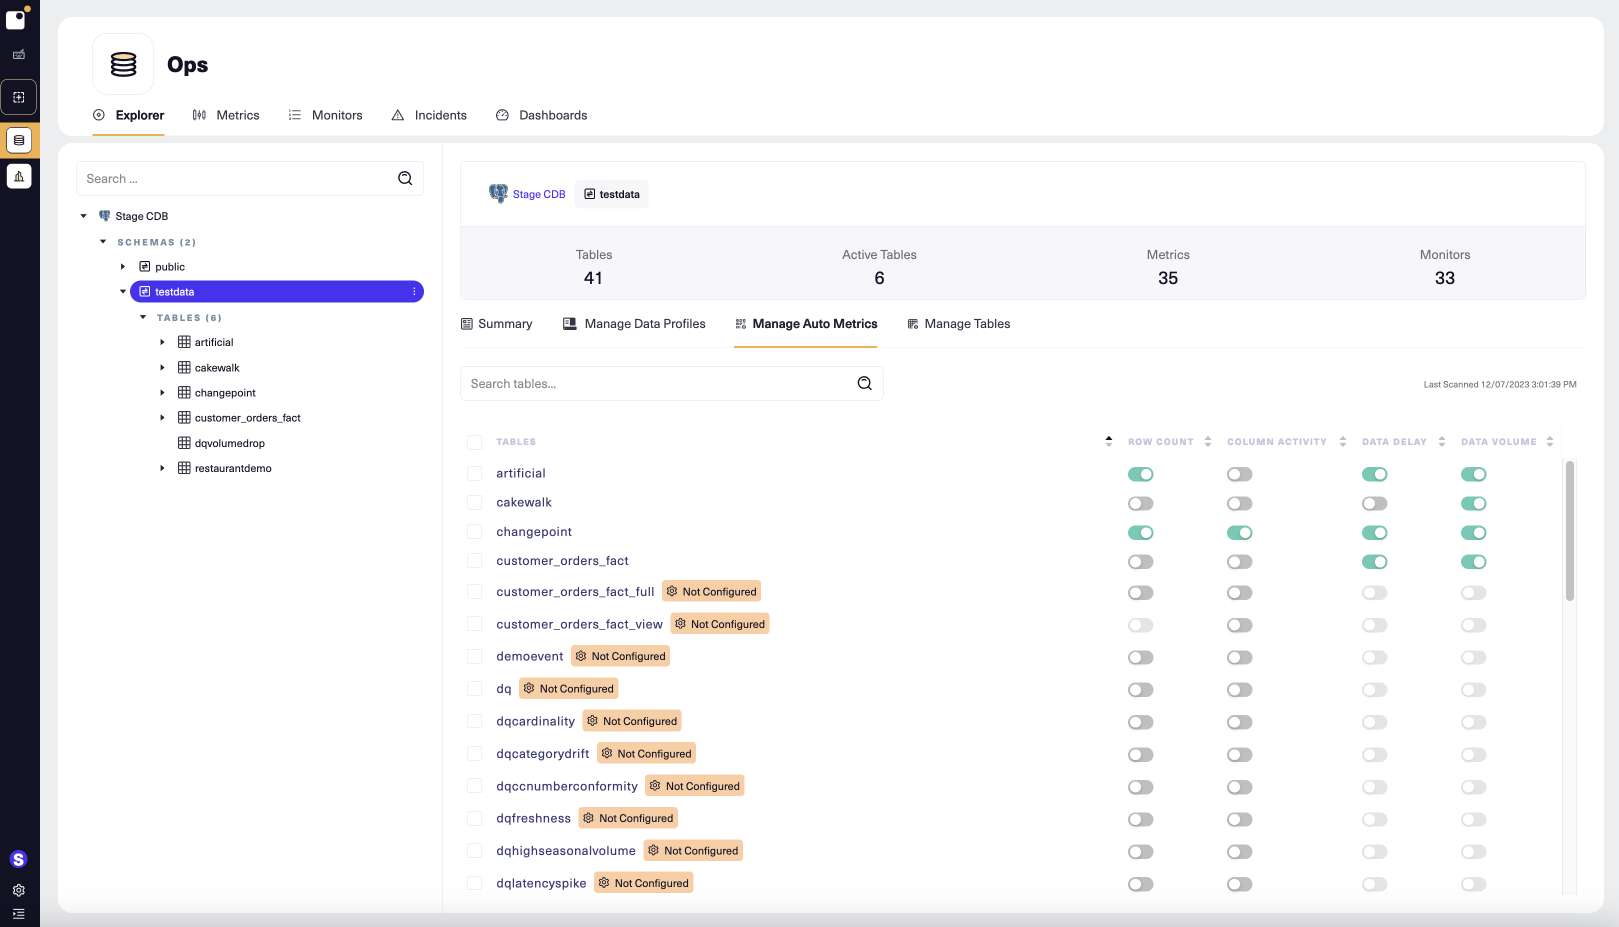
Select the schema, and then select its Manage Auto Metrics tab.
-
For each table you want to add to Explorer, switch on any active toggle. You can select multiple tables using the checkboxes on the left, and then enable metadata metrics for them by switching on the toggle for any of the selected tables. Note that metadata metrics don't have history, so after you enable one you'll want to wait for sufficient datapoints to be collected before you add and train any monitors for it.
-
To enable deep auto metrics, you must first configure the table. You can select Not Configured beside the name of any unconfigured table to configure it. After you save the table's configuration, its deep auto metrics toggles become active.
Add tables by configuring them
-
Select the schema, and then select its Manage Tables tab. (Note that for blob storage datasources, you must instead add a virtual table.)
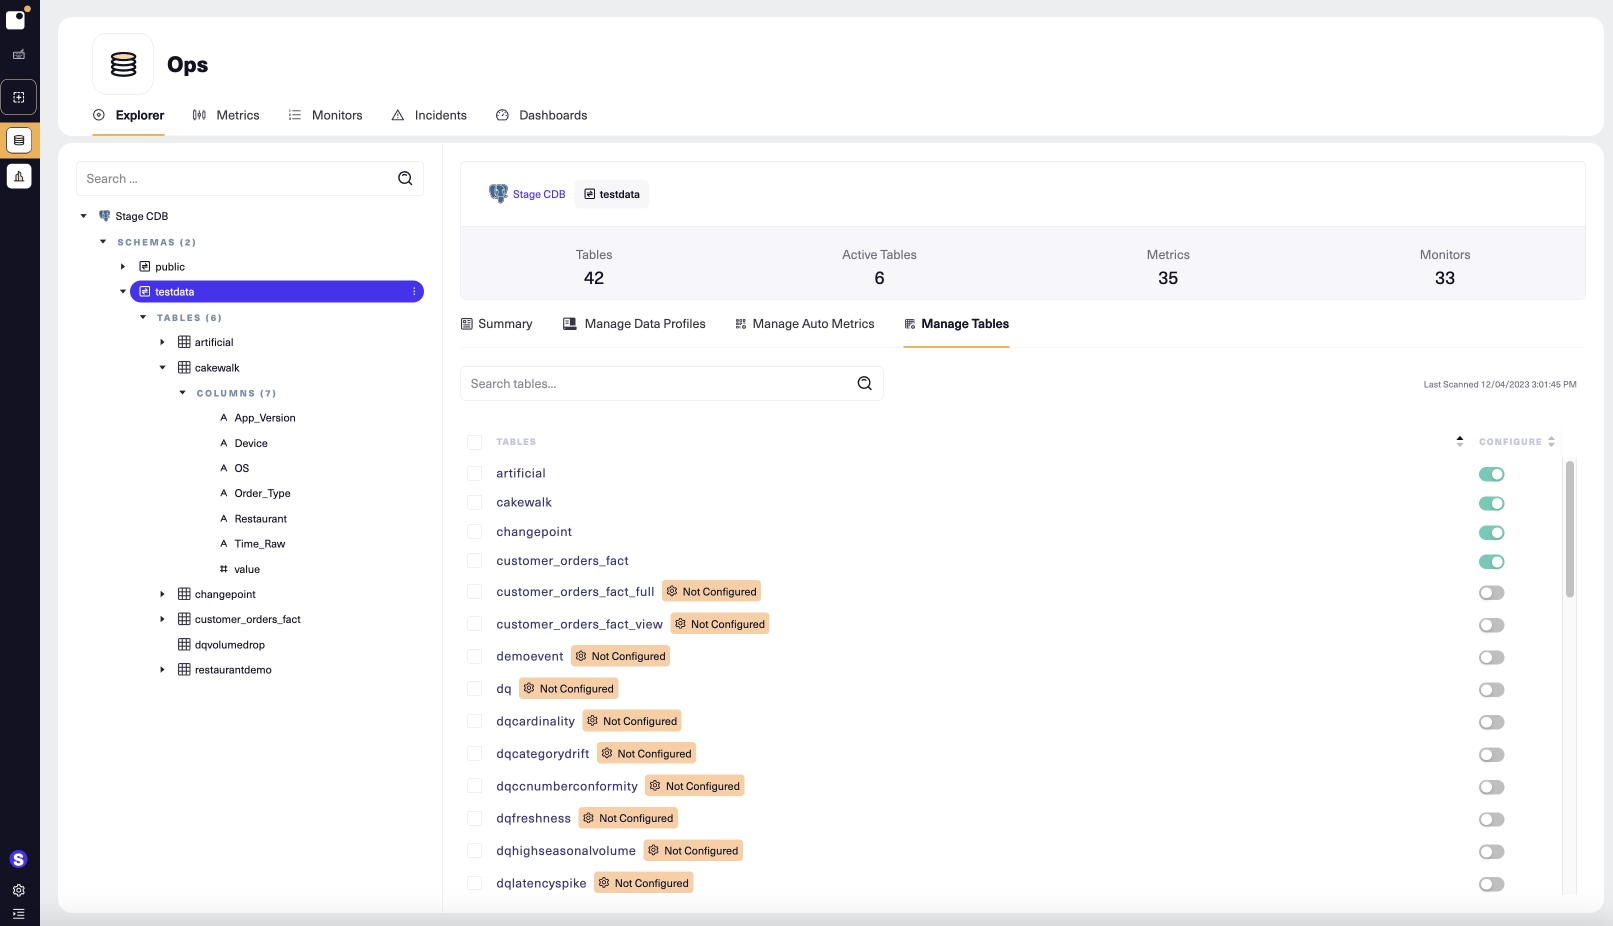
-
For each table you want to work with, switch on the Configure toggle. The table's configuration opens so you can set defaults that metrics based on the table can inherit, such as the timestamp column, the data lag (evaluation delay), and partitions. These defaults are inherited by your data quality metrics. For help, see Configure tables.
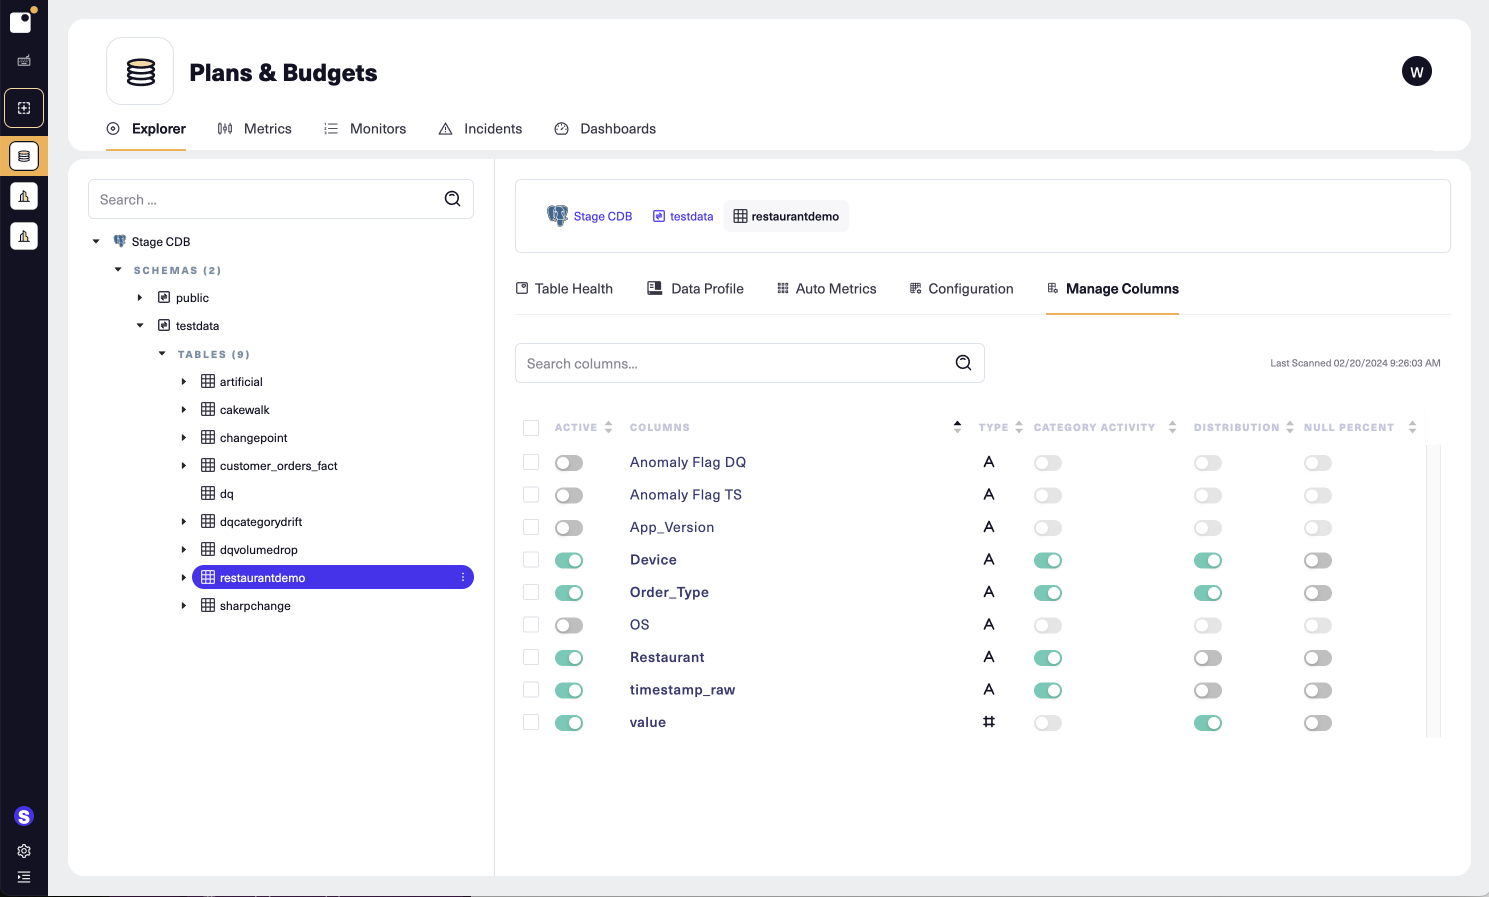
Add columns
-
Select a table in the Explorer tree, then select its Manage Columns tab.
-
To add a column to the Explorer tree, switch on its Active toggle.
-
To change a column's data type, click the A or # under Type, and then select the new data type.
-
To enable the column's auto metrics, switch on the corresponding toggles: Category Activity, Distribution, and Null Percent. Note that the Category Activity auto metric is only available for text columns in tables with Incremental query scope.
Updated 11 months ago