Data collection
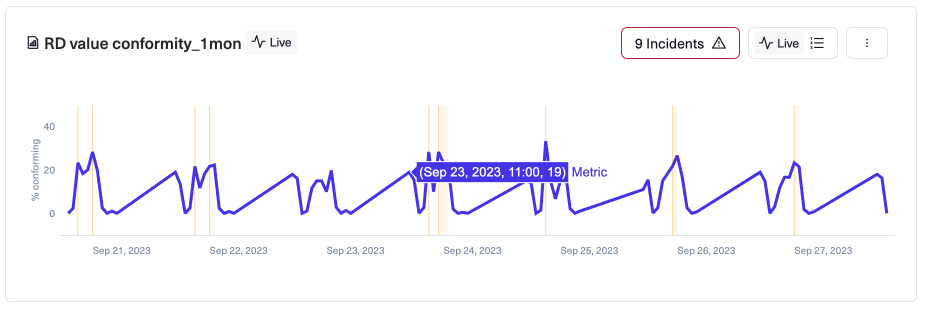
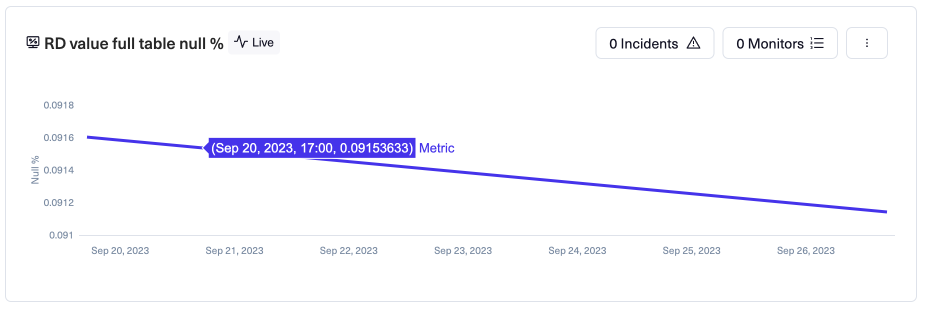
A Lightup metric tracks a series of aggregate measurements of your data. The aggregate measurement is collected by periodically querying rows in your data. The values are displayed as datapoints on a time series chart with time on the X axis and the aggregate value on the Y axis.
Each metric datapoint is the result of a data collection process. Understanding the data collection process will help you optimize your metrics so they'll be collected at the time that's best for your ETL pipeline. It's important to note that data collection for deep metrics works differently from data collection for metadata metrics.
Deep metrics data collection
The deep metrics data collection process has a large number of configuration parameters that affect the timing of data collection and which rows in the dataset are collected during each data collection.
All scheduled metrics follow the same basic data collection process: every collection interval, Lightup collects rows that fall within a collection window. Trigger metrics only collect data if they are triggered, and collect rows from all collection windows since the last time they were triggered.
A metric's Data Collection settings determine the extents of the collection window, how much data to aggregate to produce a metric value, and the frequency of data collection.
-
Query Scope is either Incremental or Full Table:
- Incremental - Data points are collected according to a time range (Example: New rows in the past hour)

- Full Table - Data points are collected without regard to a time range (Example: All rows in the table)

-
Data Collection Schedule is either Scheduled, Triggered, or Custom Schedule:
- Scheduled - Lightup will collect the metric data points on a repeating schedule, such as once an hour, once a day, and so on
- Triggered - The metric will only run when an API call triggers that metric
- Custom Schedule - A user can specify, using CRON syntax, when the metric should run (Example: Run the metric every 6 hours)
-
Data Collection Window is either Full Window or Partial Window:
- Full Window - The metric data point is collected for the most recent complete Aggregation Window (Example: A daily metric is run at 12:05 am today. The most recent complete Day is yesterday)
- Partial Window - The metric data point is collected in the assumption that the current Aggregation Window is complete (Example: A daily metric is run at 7:00 pm today. Lightup considers the data for today as "complete" and runs the metric collection on all data for today, even though there are 5 hours left in the day)
-
Aggregation Interval is the time range that Lightup uses for metric data point gathering (Example: All rows in the past hour)
-
Evaluation Delay is different depending on the Aggregation Interval:
- For Minute or Hourly Aggregation Intervals, the Evaluation Delay tells Lightup the most recent hour to consider for the metric collection (Example: Evaluation Delay set to 2 Hours will tell Lightup to only consider the data from 2 hours ago, rather than the most recent hour. In the case of Lightup running the Metric at 10:05 am, the metric will look for data in the 7:00 am-8:00 am time range). This is useful if the data has an expected lag as to when it is added or updated.
- For Daily, Weekly, and Monthly Aggregation Intervals, the Evaluation Delay will have different behaviors depending on the Evaluation Delay time object (i.e. Hour, Day, Week)
- If the Evaluation Delay is set to Hour, Minute, or Second, then Lightup will collect the daily data point on the most recent full date. But the metric will only be run at the time related to the Evaluation (Example: Evaluation Delay is set to 7 hours. Lightup will run the metric collection at 7:00 am for the previous day's data)
- If the Evaluation Delay is set to anything larger that Hour, then Lightup will collect the daily data point for that many Days, Weeks, or Months ago (Example: Evaluation Delay is set to 2 days. Lightup will run the metric collection at 12:00 am on January 3rd for data on January 1st)
-
For Full Table metrics, there are alternatives to Evaluation Delay, which are Polling Delay and Polling Interval
- Polling Delay adds a delay to the start of data collection. Once the delay period has passed, the metric is scheduled to run. This delay may be exceeded depending on system load, but will always at least be met.
- Polling Interval determines how often data collection occurs if Data Collection Schedule is set to Scheduled.
Metadata metrics data collection
Like deep metrics, metadata metrics periodically collect data to produce a datapoint, based on their data collection settings. Unlike deep metrics:
- Metadata metrics don't query your data assets during data collection. Instead, these metrics query system tables that are updated during schema scans (both scheduled and manual).
- Metadata metric data collection settings can't be changed.
Event metrics
Two metadata metrics— Table Activity and Column Activity— are event-based: they expose system events that are detected during schema scans (both scheduled and manual). These activity metrics create datapoints that sum the system events detected by schema scans since their last data collection. Note that if multiple changes to the data asset occur between schema scans, some changes might not be detectable as events. For example, if a table is added and then dropped and no scan occurs between the two events, neither event is detectable by the Table Activity metric because the schema has the same tables before and after the events. However, if a table is added and a different table is dropped, both events are detectable.
Updated 8 months ago
