
Schemas
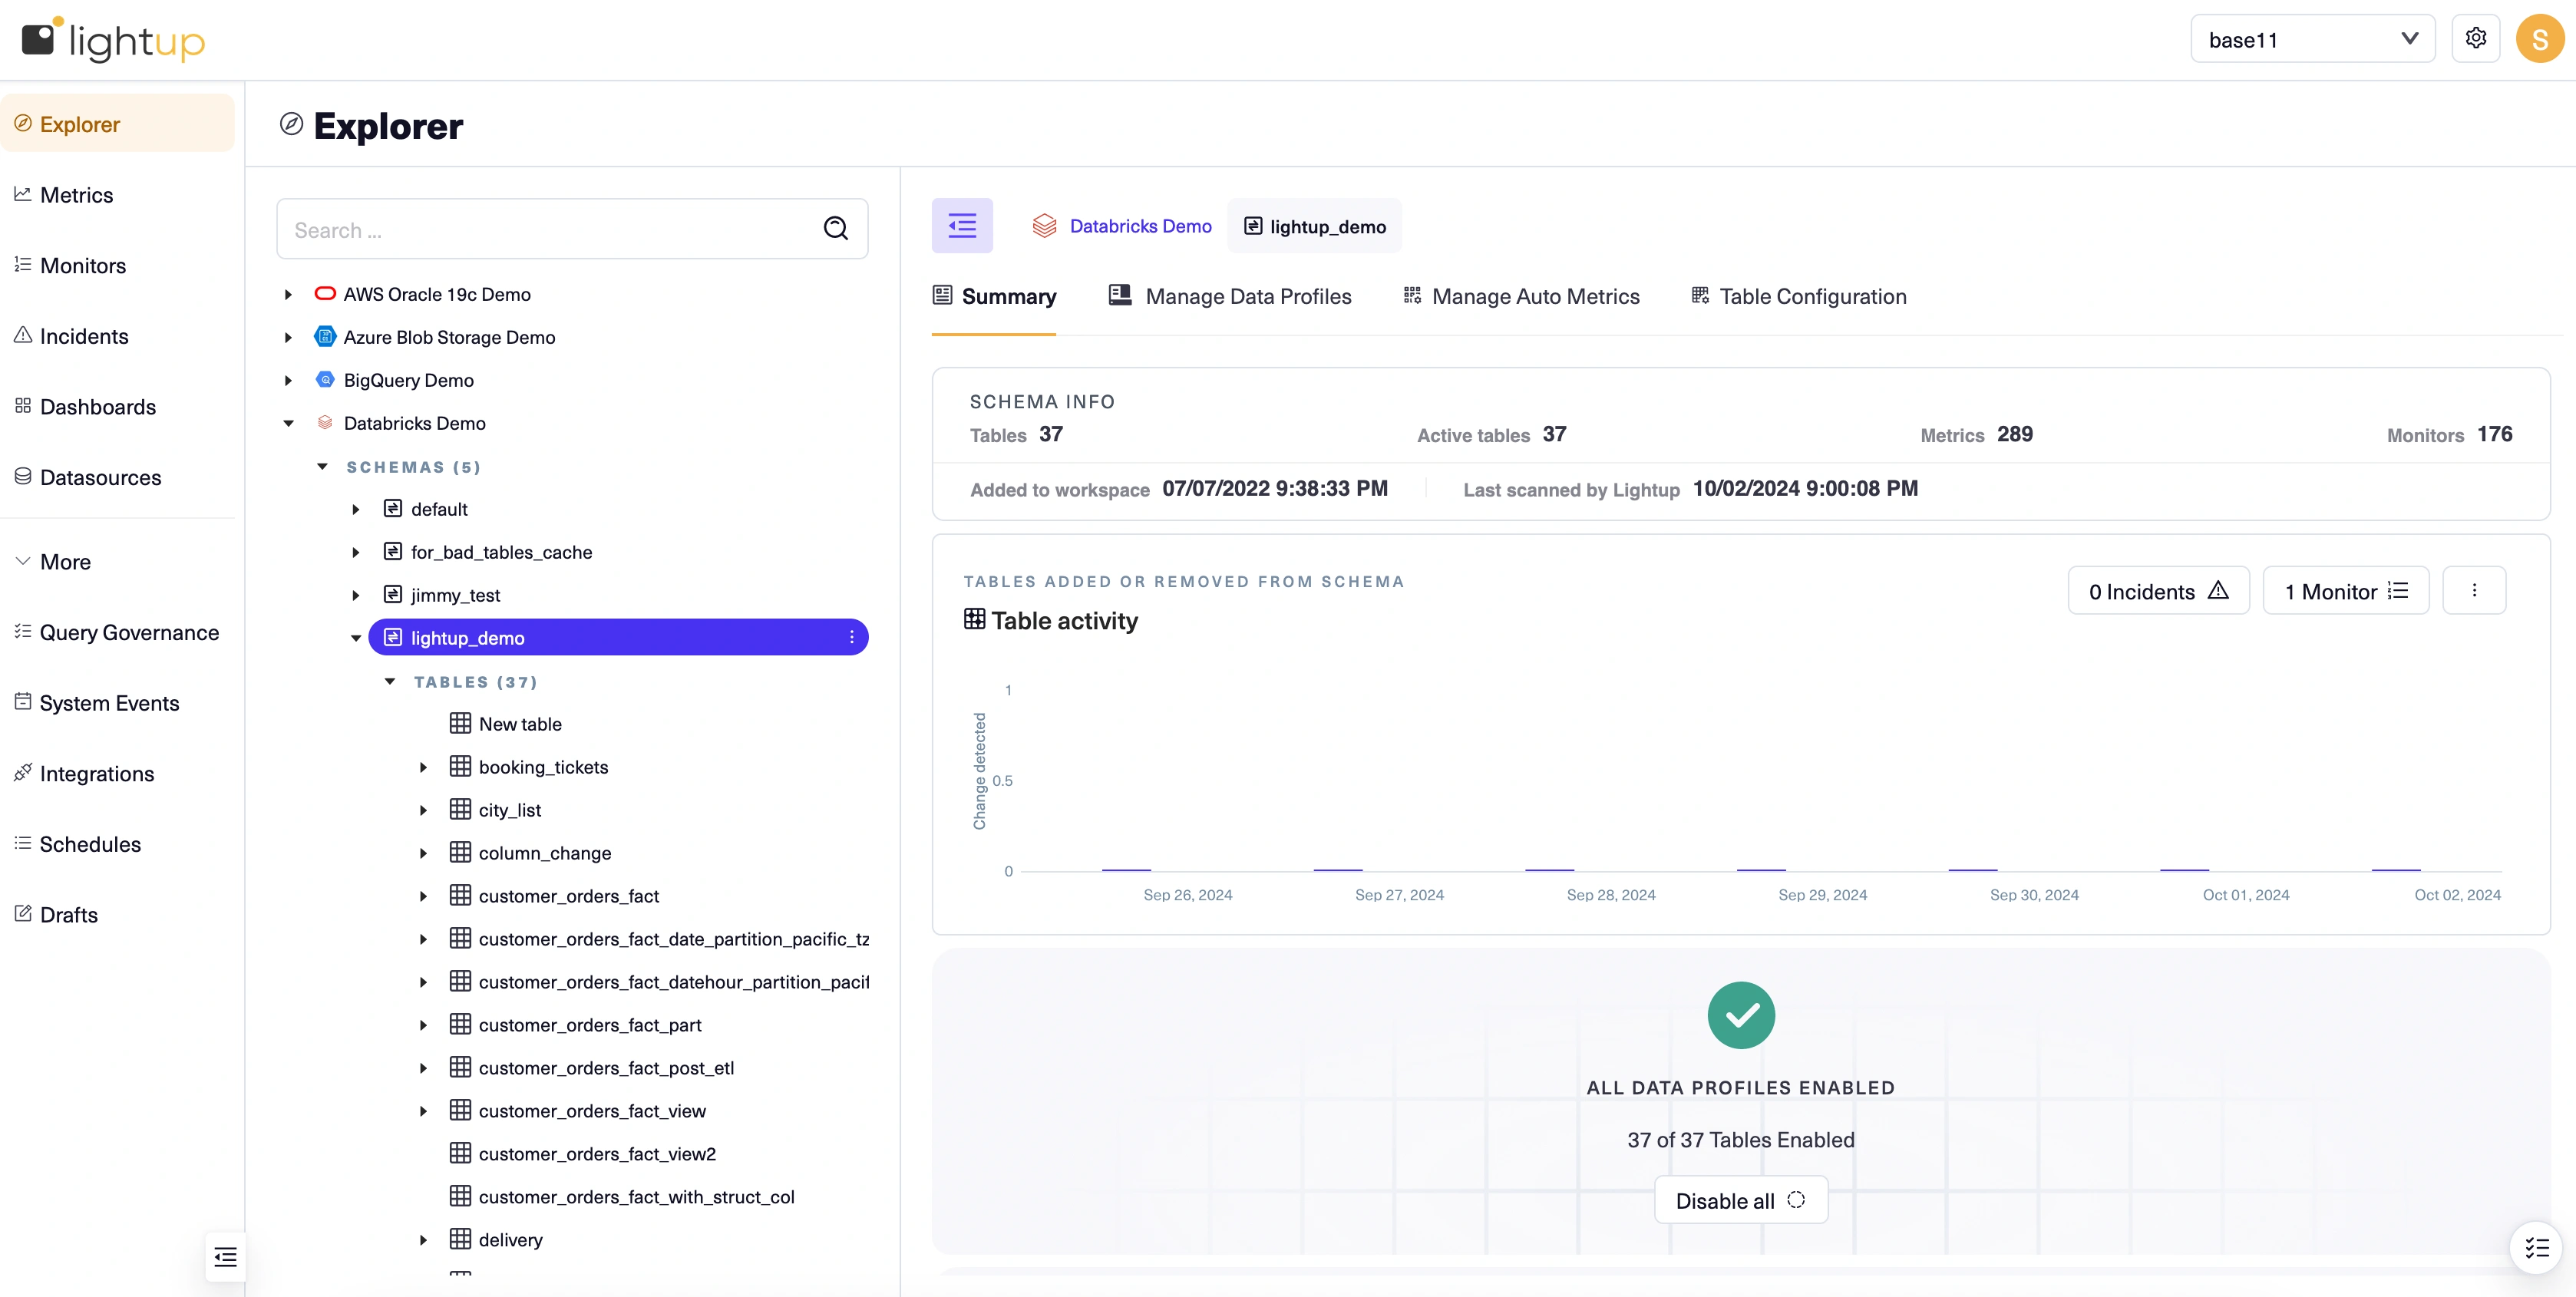
When you select a schema in the Explorer tree, information about the schema appears at the top of the main window: a breadcrumb you can use to navigate, below which are counts of the schemas tables, active tables (ones that you've configured), metrics and monitors.
As with datasources, you can also enable and disable all the metadata metrics and data profiles for a schema's tables using commands on tabs to the right of the Explorer tree.
In addition, schemas have a Table activity auto metric. If this auto metric is enabled its chart appears on the Summary tab so you can monitor it and review any detected incidents.
Updated 10 months ago
Did this page help you?