
Triggered metric collection
When you set a metric's Data collection schedule to Triggered, metric collection occurs only after you trigger it, during the next collection cycle. You can trigger metric collection in one of four ways:
- Programmatically, by calling into the SDK or API
- By clicking Run Now in the metric's Actions menu
- By clicking Run Trigger Metrics in a table's Actions menu, which runs all of the table's trigger metrics
- If the metric hasn't been triggered yet, by clicking Trigger Metric in the metric's chart in Explorer
Trigger metric collection
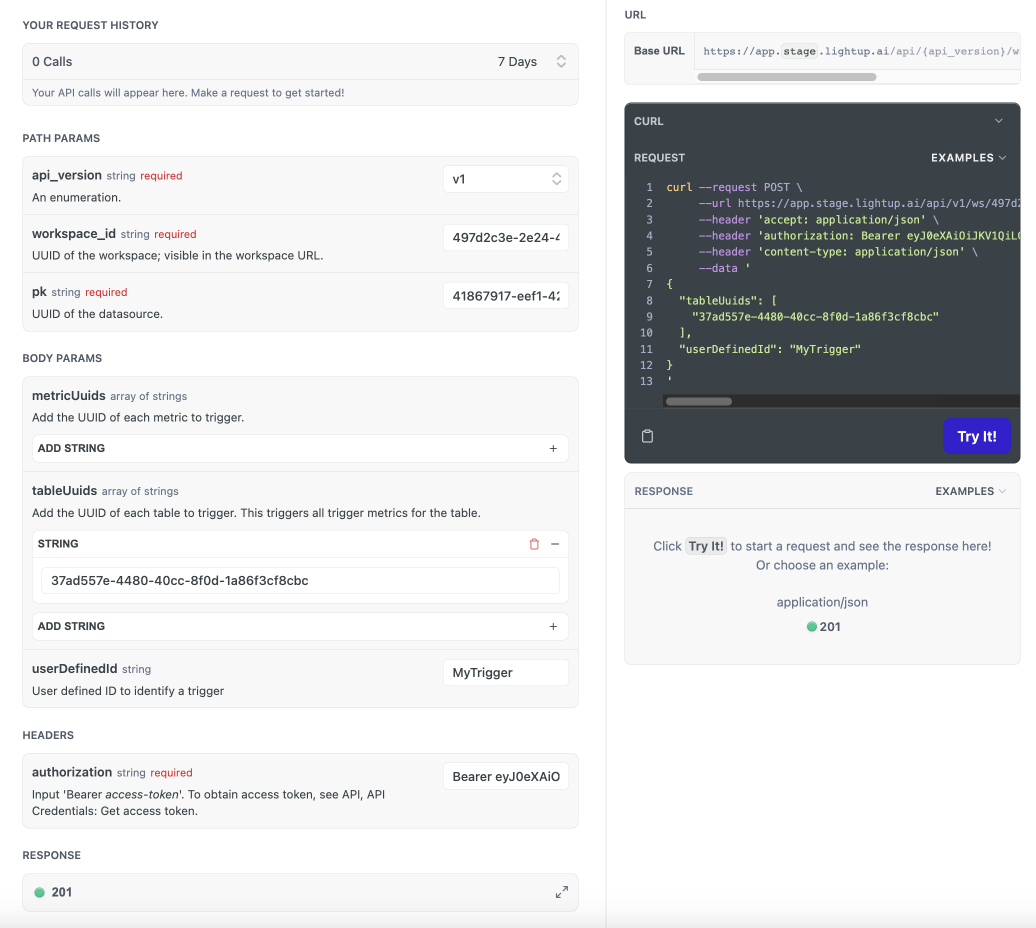
- Open the Trigger metric collection reference.
- Under PATH PARAMS, enter UUIDs for the workspace and datasource.
- Under BODY PARAMS, add UUIDs for at least one table or metric where you want to trigger collection.
- Under HEADERS, enter Bearer <your-access-token> (swap in the access token you got from the Get access token API).
- You can enter a unique string in userDefinedId to identify the trigger. This ID can be used to query for the status of the trigger. Your page should resemble the following image:
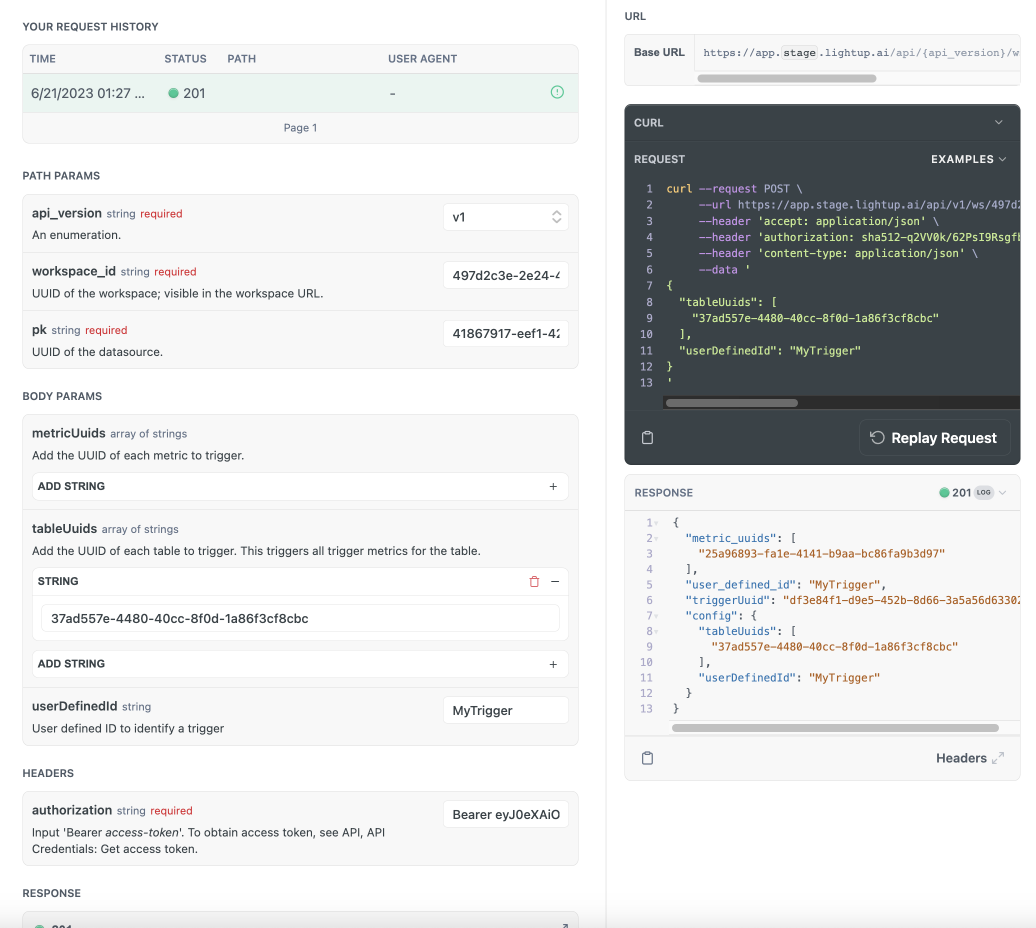
- On the right select Try It! to generate the API call for you— to create a trigger on the objects you specified. The Response contains identifiers for the objects where data collection will be triggered, as well as the trigger's UUID and (if you added one) its unique userDefinedId.
Save an API call for reuse
If you plan on using an API call routinely, you can save time by creating a script to modify and run.
- Near the top right of the API Reference page (to the left of the Try it! button), select the clipboard icon to copy the code sample, then save it locally as a text file.
- When you use it, you'll need to get a fresh access token and update your Authorization parameter accordingly.
- To use it, update the authorization parameter, then paste the modified script at a command line prompt and run it.
When triggered data collection occurs
When you trigger data collection, the triggered metrics aren't collected immediately. When a metric is triggered, the system records a trigger request and waits until the next Lightup internal polling interval to execute (usually a 5-minute interval). Upon execution, the system aligns to a preset aggregation interval. For example:
- If the metric aggregates daily (midnight to midnight) and the system receives a trigger request at 3AM, it will poll midnight to midnight.
- If the metric aggregates hourly and the system receives a trigger request at 4:15pm, it will poll 3-4PM.
If an evaluation delay is specified, data in an aggregation interval that includes “now - eval delay” will not be collected. For example:
- If metric aggregates hourly with an eval delay of two hours and the system receives a trigger request at 4:15PM, it will poll 1-2PM.
Collection will start at the first aggregation interval that has not yet been collected. For example:
- If metric aggregates hourly and the trigger request is received at 4:15pm Wednesday and the previous trigger request was at 4:15Ppm on Tuesday, data for 24 hourly periods starting 4-5pm Tuesday and continuing to 3-4 pm Wednesday will be collected.
If the system receives multiple trigger requests within the same aggregation window, the first trigger executes and the rest are ignored.
Check when collection will occur
You can check Explorer to see when collection will occur:
- On the left, select a table, metric, or metric slice that has been triggered for data collection.
- On the right, at the top left corner of a triggered metric's chart, point to the metric type icon until a pop-up appears, and then select Metric Collection.
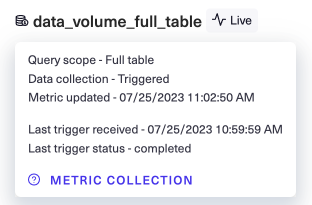
- Information about the timing and extent of metric data collection appears in a new pop-up.
Updated over 1 year ago