Get Oriented in the UI
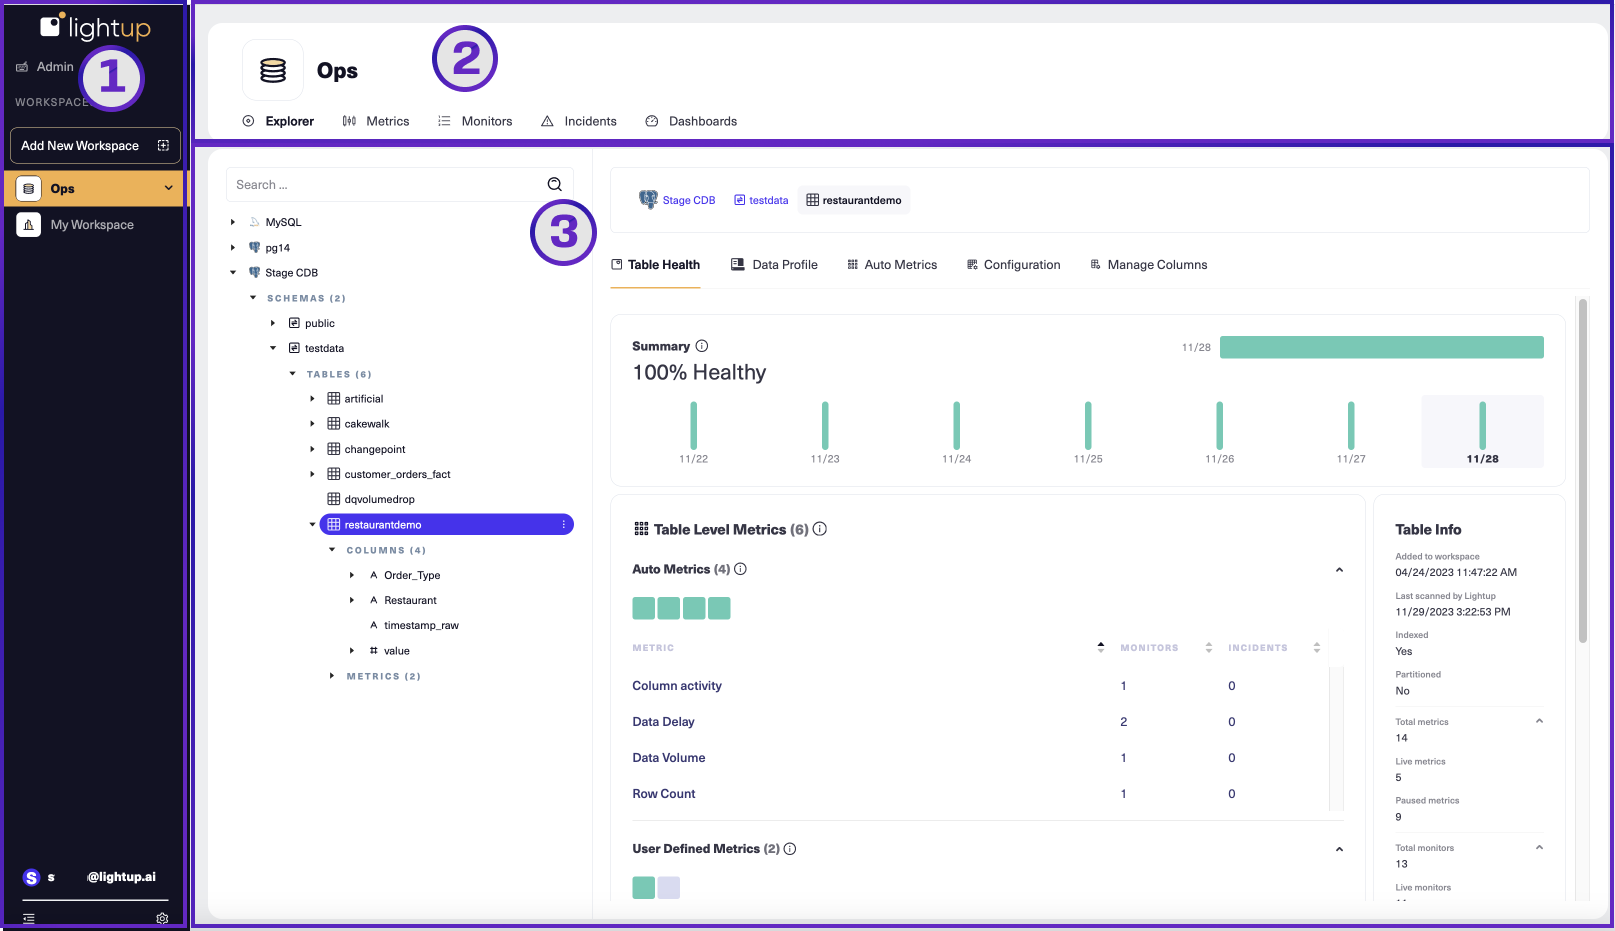
The Lightup app has three main areas:

- The left pane lists workspaces. You can resize the left pane by dragging its right edge, or use the collapse button at the bottom to fully collapse it (but it will still display workspace icons so you can switch between them). You can also do app-level commands such as contact support, generate API credentials, and logout from the settings wheel at the bottom.
- The top bar has tabs for working with data quality components.
- The main page changes to reflect your choices on the left pane and the top bar. This is where you work with data quality components inside a specific workspace.
The left pane: app settings and workspaces
Your app role establishes what you can do. Look at the top of the left pane to see which app role you have:
-
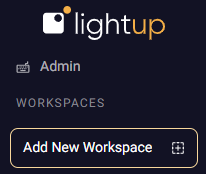
If you're an App Admin, you'll notice an Admin menu right under the app logo. As an App Admin you can create and manage Lightup user accounts, roles, and workspaces.

-
If you're an App Editor, you won't find an Admin button, but you will notice the Add New Workspace button. As an App Editor, you can create and manage workspaces, and can invite other Lightup app users to your workspaces.
-
If you don't have an Admin menu or an Add New Workspace button, you're an App Viewer. You can be invited to join a workspace. In the left pane, you'll see a list of workspaces where you're a member. Select the arrow at the right edge of a listed workspace to open a menu of commands for that workspace.
The top bar: navigation
The top bar offers a set of tabs you can select to focus on a specific quality monitoring process in a workspace.
- Select Explorer to manage data quality while viewing your data asset structure in your Explorer tree, which shows all of the workspace's datasources.
- Select Metrics to focus on metrics (the aggregated, periodic queries that measure data quality).
- Select Monitors to focus on monitors (the regular checking of metric values).
- Select Incidents to review recent data quality incidents.
- Select Dashboard to open the workspace's data quality or incident dashboards.
The main page: get stuff done
All data quality work you do in the Lightup app, you do in the main page. When you pick a workspace its Explorer tab appears in the main page, displaying a tree view of your data assets on the left and asset-focused tabs with data quality analysis tools on the right. This combination lets you quickly set up your asset hierarchy for data quality analysis and health monitoring, from datasources down to individual columns.
Updated 8 months ago
