---
updatedAt: 2025-09-08T23:49:13.000Z
---
Fetch the complete documentation index at: https://docs.lightup.ai/llms.txt. Use this file to discover all available pages before exploring further. Append .md to any documentation page URL to get its markdown version.
# Analyze an incident
You can analyze an incident to understand the data quality issue behind it. Your analysis can (and often will) include other metrics and incidents that are relevant in some way— through time correlation, for example, or through sharing a metric.
* Lightup automatically identifies time-correlated incidents that you could include in your analysis.
* You can search for other metrics and add them to your analysis.
* You can add [related metrics](https://docs.lightup.ai/docs/related-metrics) during metric configuration— these become **Related Metrics** for incidents that come from the metric.
# Add a comment
You can add comments as part of analyzing an incidents. Comments appear on the incident's Activity tab.
1. On the incident details page, select the incident's menu, then choose **Add Comment**.
2. Enter your comment, then select **Submit**. The **Activity** tab appears and displays your comment in chronological order.
## Edit or delete a comment
If you have sufficient permissions, you can edit and delete comments.
1. On the incident's **Activity** tab, select the comment.
2. On the right, select the **Edit** icon or the **Delete** icon.
# Submit a ticket
If your workspace has a suitable integration set up, you can submit a ticket to track the work associated with analyzing the incident.
1. On the incident details page, select the incident's menu, then choose **Submit Ticket**.
2. On the **Submit ticket** form, select a value for **Integration**. The form options change to reflect the integration you chose.
3. Verify or fill out the remaining fields, then at the top select **Submit**.
# Add metrics of interest
The collapsible left panel (which is closed when you first open the incident) lists groups of metrics that you can include in your analysis.
* **Metrics of interest** are metrics that you have chosen to compare with the incident. The charts for these metrics appear below the incident chart. You can select a metric of interest to open it in Explorer, hide its chart in the incident details, or remove it from **Metrics of interest**.
* **Related metrics** - You can add related metrics to a metric when you configure it (in Step 4 of metric configuration). Related metrics then appear in analysis of any incident from the metric. You can select a related metric to open it in Explorer or add it to **Metrics of interest**.
* **Time-correlated** - These are metrics that have incidents that occurred around the same time as the one you're analyzing. You can select a time-correlated metric to open it in Explorer or add it to **Metrics of interest**.
* You can hover over a metric's icon (just left of its name) in the panel to get more information.
* Sliced metrics show the count of slices with incidents and the total number of slices. You can expand a sliced metric to review the slices.
## Find a metric
1. At the top of the left panel, select **Actions > Find a metric**.
2. In the **Find any metric** pane, click **Search metric name** and then enter a search term. Matching items appear as you type.
3. When you find a metric you want to include, click **Add**. The chart for the selected metric appears on the **Charts** tab, below the incident chart.
# Incident analysis
Information about the incident is on four tabs:
* The **Chart** tab shows the incident chart at the top, and any metrics of interest you add.
* The **Summary** tab is a repository of information about the incident, with links to related components.
* The **Failing Records** tab shows the result of the failing records query associated with the metric. If no failing records query is present, the tab does not appear. If the query governance flag **Enable failing records count cache** is enabled, then failing records count are fetched and cached automatically when an incident is created. If that governance flag is enabled, and the incident is ongoing (has not ended) in subsequent metric collections, the failing records count is updated with the new count of failing records
* The **Activity** tab lists actions that have been taken that affect the incident.
## Chart
On the Chart tab, you can set a timeframe to include more data points in the displayed charts. The first chart is the incident chart. The charts for any metrics of interest you add appear below the incident chart. Within a chart, you can turn on threshold data to help you visualize how the metric deviated. On the chart for the incident, you can set the incident's Status.
### Set a timeframe
On the right just above the charts, click the dates to change them. You must confirm both dates even if you only change one (i.e., click **OK** twice).
### Turn on threshold data
You can view threshold data for the incident chart and for the metrics of interest charts you add. When you add the chart for a metric of interest that has multiple monitors, you must choose a monitor to turn on threshold data.
* Incident chart/Metric of interest chart with one monitor: In the chart where you want to see thresholds, on the metric's menu select **View Threshold**.
* Metric of interest chart with multiple monitors: In the chart, on the Monitors menu select a monitor, and then select **View This Monitor**. Threshold data will display on the chart when you choose a monitor. To hide it, on the same menu, select **Hide Threshold**.
### Hide or remove a metric of Interest
If you no longer want to see the chart for a metric of interest on the Chart tab, you can hide it (if you plan to display the chart again); or, you can remove the metric from the Metrics of Interest list (if you no longer want the chart to be available on the Chart tab).
* Hide: On the chart's **Actions** menu, select **Hide**.
* Remove: In the left panel, select the metric. Then on the panel's **Actions** menu select **Remove From Metrics Of Interest**.
### Set the incident Status
You can change the status of an incident to manage how it is handled. Most incident statuses don't affect how Lightup behaves, but you can use them to sort or filter the incidents you see. However, incidents with *Rejected* status don't show up in Explorer views.
## Summary
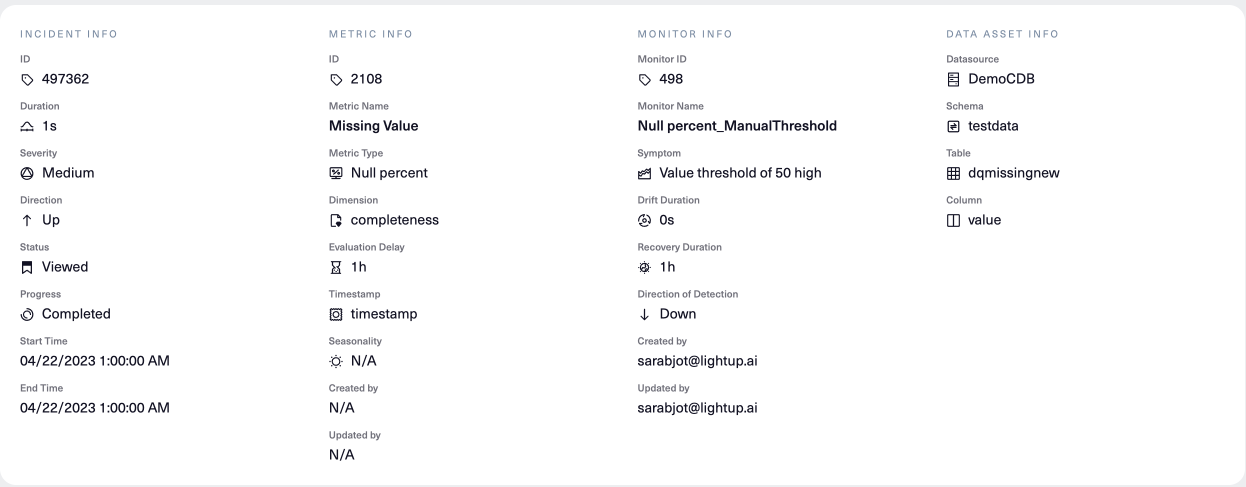
The Summary tab is organized into four columns: Incident Info, Metric Info, Monitor Info, and Data Asset Info. Select the **Metric Name** to edit the metric or to view it in Explorer. Select the **Monitor Name** to edit the monitor.
## Failing Records
A [failing records query](failing-records-query) is a query you can use to select the records to analyze as part of the incident. If the incident's metric has a failing records query, you can review it on the **Failing Records** tab. [Null percent](https://docs.lightup.ai/docs/null-percent-metrics) and [Conformity](https://docs.lightup.ai/docs/conformity-metrics) metrics have default failing records queries, and you can create your own for any metric.
### Review the failing records query
1. In the incident, select the **Failings Records** tab.
2. At the top of the **Failing Records** tab the SQL for the query appears in a text box.
3. By default, the query returns 100 rows. Just below the SQL box, you can enter a different value for **LIMIT** to return that many rows instead.
4. Select **Run Query** to see the results— the "failing records". These appear in a paginated list below the SQL box.
5. Click **Download** to download the results in .CSV format.
6. You also see a record of the count of failed rows.
1. Note that when an incident is generated, the count of rows will have to be manually fetched using the "Get count" button when the Query governance flag "Enable failing records count cache" is disabled (default).
2. When the "Enable failing records count cache" is enabled, the count of failed records is automatically generated (only for incidents that are newly generated after the flag has been enabled), and is updated if the incident is ongoing (hasn't ended yet), on subsequent metric collections.
## Activity
Activities taken on the incident are listed on the Activity tab. This helps you coordinate your analysis with your colleagues. If an activity was done by a person, their email address is included in its list item.
The following activities are listed:
* Incident started
* Incident ended
* Validation started
* Validation resolved
* Validation unresolved
* Validation error
* Someone adds a comment
* Someone submits a ticket (e.g., creates a task in Jira to track the incident)
* Someone changes the Status, such as by viewing an *Unviewed* incident
### Edit or delete comments
Comments listed on the Activity tab have the prefix ***Comment:***. If you have the right role, you can edit or delete a comment by using the icons to its right.
# Validate an incident fix
Validation is currently not supported for column activity metrics, compare aggregate metrics, data delay metrics, row by row compare metrics and table activity metrics
After you review an incident and take actions to correct the data quality issue, you can validate that your fix addresses the incident— that the data quality issue is resolved.
1. On the incident chart, select **Run validation**. Lightup begins checking to see whether the data quality incident is fixed, and the button text changes to **Running validation...**.
2. To cancel, select **... → Cancel validation**.
3. After validation finishes running, the button text changes again to reflect the outcome:
* **Resolved** if the issue is fixed
* **Unresolved** if the issue is still present
4. If validation indicates the incident is resolved, consider changing the incident status to **Closed**.
# End an incident
By default, an incident's Progress field will remain 'Active' until a sufficient number of metric datapoints are collected (according to the monitor's recovery duration) to return within the spec of the monitor threshold. If you desire to end an incident manually (and force a new incident to get created on the next collection cycle), you may do so using the 'End incident' action available in the incident menu. This will be captured in the activity log and the Progress will update to 'Completed' on the next data collection cycle.